Veterans face unique challenges that can put them at higher risk for substance abuse than the general population. Factors leading to increased risk include things like PTSD and homelessness.
Drug & Alcohol Addiction Rehab, Treatment & Recovery Resources in Illinois
TABLE OF CONTENTS
Getting Help
From 2006 to 2015, drugs and alcohol caused 1,142,297 deaths in Illinois. With the necessary help, many of those deaths could have been prevented. This guide will show you the specific process for getting help in the state of Illinois.
What to Consider When Choosing a Rehab Center
There are many different types of rehab programs and treatment options to consider. Some of the questions you should ask are:
- Which service setting is best for me? Consult the following guides to understand residential inpatient programs and outpatient programs.
- Which specialized rehab programs do I need? Read up on the differences between holistic rehabs, rehabs for dual diagnosis, and programs only for alcohol and drug detox.
- How long should I stay? Consider the differences between a shorter rehab length (30 days) or a longer-term option (60, 90, or 120+ days).
The severity of your addiction and your specific personal and financial situation will be the main factor that determines the best rehab option for you.
For more information on how to make all of these decisions, read our guide to Choosing the Right Rehab.
The Highest Rated, Low-Cost Rehabs in Illinois
If the cost of rehab is a barrier for you (as it is for many) and you don’t have insurance, there are still ways for you to get help. Out of the 584 rehab facilities recognized by the Substance Abuse and Mental Health Administration (SAMHSA) in Illinois, 93 offer some sort of payment assistance to most adults. Out of those 93 rehabs, Behavioral Services Center – Elmhurst Campus near the O’Hare International Airport in Chicago, received the highest overall scores.
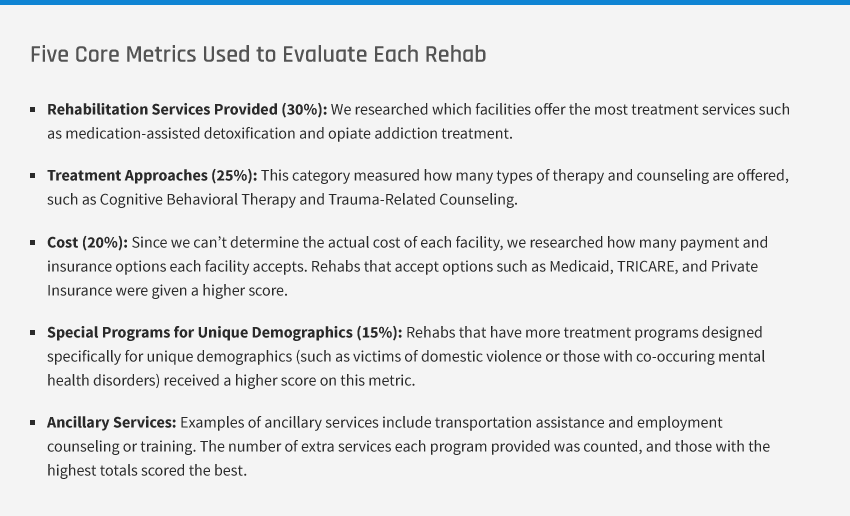
For more information about the five core metrics, head to the full breakdown of our filtering process and ranking methodology
1. Behavioral Services Center - Elmhurst Campus
The Elmhurst Campus of Behavioral Services Center offers group classes, outpatient, and intensive outpatient treatment services and is located near the O’Hare International Airport in Chicago. The rehab received an overall score of 9.2, and it’s highest score was on the metric that measured rehab services provided. It provides 13 different rehab services, which was the highest total of all the rehabs we researched.
The rehab’s weakest performance came on “Cost” – it was given a score of 7.7, which is still considerably above average. The main factor that kept the facility from scoring higher was the fact that it doesn’t offer any other type of payment assistance besides sliding scale fees.
- Rehabilitation Services Provided: 10
- Treatment Approaches: 10
- Cost: 7.7
- Special Programs for Unique Demographics: 8.3
- Ancillary Services: 9.5
2. Behavioral Services Center - Skokie Campus
While the Skokie Campus of Behavioral Health Services is run by the same company that runs the Elmhurst Campus, the Skokie Campus received slightly lower scores in “Cost” and “Special Programs for Unique Demographics.” The Skokie Campus offers two less special programs for unique demographics than Elmhurst does. However, it does provide two more ancillary services than the Elmhurst Campus, giving it a perfect score in that category, while Elmhurst received a 9.5.
Like the Elmhurst Campus, the Skokie Campus of Behavioral Health Services exclusively provides several types of outpatient treatments.
- Rehabilitation Services Provided: 10
- Treatment Approaches: 10
- Cost: 6.6
- Special Programs for Unique Demographics: 8.3
- Ancillary Services: 10
3. Behavioral Services Center - Chicago Loop Campus
Like the Skokie and Elmhurst Campuses, the Chicago Loop Campus is run by Behavioral Services Center and provides outpatient, intensive outpatient, and individual therapy sessions to the greater Chicago area.
The special programs for unique demographics that Behavioral Services Center – North Clark Street Campus offers is the program’s biggest drawback, followed closely by its performance on the “Cost” core metric. On the other hand, the facility was given perfect scores on “Rehabilitation Services Provided” and “Treatment Approaches.”
- Rehabilitation Services Provided: 10
- Treatment Approaches: 10
- Cost: 6.6
- Special Programs for Unique Demographics: 6.4
- Ancillary Services: 9.5
Top-Rated, Low-Cost Treatment Centers in Illinois
| Rank | Rehab | Total Score | Contact Information |
| #1 | Behavioral Services Center – Elmhurst Campus | 9.2 | 188 Industrial Drive Suite 100 Elmhurst, IL 60126 Main Tel: 847-929-4068 Intake Tel 1: 847-673-8577 |
| #2 | Behavior Services Center – Skokie Campus | 9.1 | 8707 Skokie Boulevard Suite 207 Skokie, IL 60077 Main Tel: 847-673-8577 Intake Tel 1: 847-929-4068 |
| #3 | Behavioral Services Center – Chicago Loop Campus | 8.8 | 161 North Clark Street Ste 1600 Chicago, IL 60602 Main Tel: 847-673-8577 Intake Tel 1: 847-929-4068 |
| #4 | Behavioral Services Center – Mundelein Campus | 8.5 | 25975 Diamond Lane Rd #111 Mundelein, IL 60060 Main Tel: 847-929-4068 Intake Tel 1: 847-673-8577 |
| #5 | Behavioral Services Center – Gurnee Campus | 7.4 | 5101 Washington Rd Ste 1114 Gurnee, IL 60031 Main Tel: 847-673-8577 |
| #6 | ABRAXAS Youth and Family Services Southwood Interventions | 6.9 | 5701 South Wood Street Chicago, IL 60636 Main Tel: 773-737-4600 |
| #7 | Leyden Family Service SHARE Program |
6.5 | 1776 Moon Lake Blvd Hoffman Estates, IL 60169 Main Tel: 847-882-4181 Intake Tel 1: 847-843-4949 |
| #8 | Gateway Foundation Alcohol and Drug Treatment/Lake Villa | 6.1 | 25480 West Cedar Crest Lane Lake Villa, IL 60046 Main Tel: 847-356-8205 x3366 Intake Tel 1: 847-356-8205 |
| #9 | Trilogy Inc | 5.7 | 1400 West Greenleaf Avenue Chicago, IL 60626 Main Tel: 773-508-6100 Intake Tel 1: 773-508-6100 x4060 |
| #10 | Lake County Substance Abuse Program | 5.5 | 3004 Grand Avenue Waukegan, IL 60085 Main Tel: 847-377-8120 |
Finding a Substance Abuse Treatment Center in Illinois
Start by determining your coverage
If you have private insurance or coverage purchased through the state’s healthcare marketplace, contact your provider to determine your exact level of coverage. If you’d like to find out if you qualify for Medicaid, visit benefits.gov to get started.
Use our database to find a treatment center near you
The tool below lists all of the treatment centers in the state of Illinois recognized by the Substance Abuse and Mental Health Services Administration (SAMHSA). Input your zip code and select the filter icon to find relevant rehabs near you.
Schedule an assessment
If you’re seeking treatment that is covered by insurance, your first step will likely be scheduling an assessment by a qualified therapist or counselor. Most facilities provide assessments, or your primary care provider may be able to refer you. Contact companies in our database above to find out if they will provide this service.
Find a Rehabilitation Facility Near You

Filter Your Search
Popular Searches
Type Of Care
Treatment Approaches
Service Setting
Age Groups Accepted
Ancillary Services
Facility Operation
Facility Smoking Policy
Gender Accepted
Language Services
License Certification Accreditation
Payment Assistance Available
Payment Methods and Insurance Accepted
Special Programs Groups Offered
What to Expect in Rehab
Although the specifics of every rehab are different, the core process of rehabilitation remains the same.
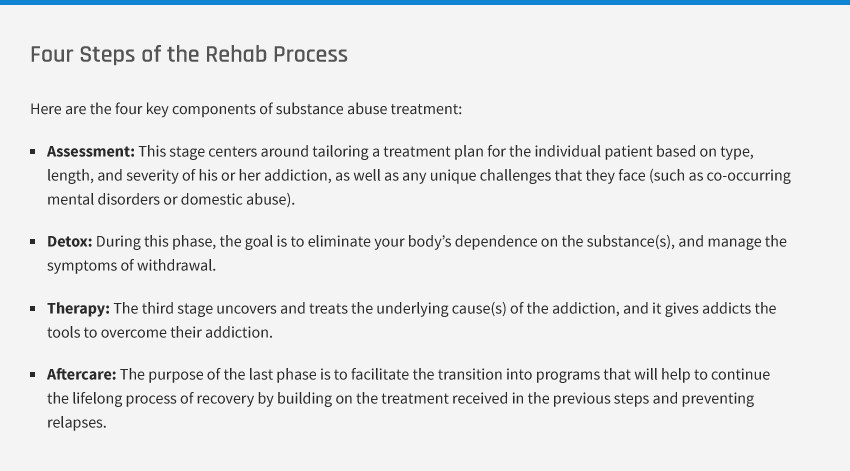
For more on what to expect in rehab, read our guide on the addiction rehabilitation process
Rehab for At-Risk Groups
Substance Abuse Treatment for Veterans
1 in 15 veterans had a substance use disorder in 2015
1 in 15
Veterans had a substance use disorder in 2015
Veterans face unique challenges that can put them at higher risk for substance abuse than the general population. Factors leading to increased risk include things like PTSD and homelessness.
Veterans have access to additional resources for treatment, and VA benefits often cover the cost. To get help with substance abuse from the VA health care system follow these steps:
- Enroll: If you aren’t enrolled already, you can check the Illinois benefits page to begin the process of enrolling in the Veterans Alcohol and Drug Dependence Rehabilitation Program. Alternatively, you can check your eligibility by using the Health Benefits Explorer, and then complete the application.
- Discover: Find out whether your local VA center provides substance use disorder (SUD) treatment by calling or visiting the center. If you don’t know where the closest VA is, call the VA hotline to find out: 1-800-827-1000.
- Find Treatment: If your local VA does provide SUD treatment, then discover what your options are and enroll in treatment. If your local VA doesn’t provide SUD treatment, then use the SUD program locator to find one that does.
You can also use the appropriate filter in our database above to find veteran-specific treatment options.
For more information, read our guide on Substance Abuse Rehab for Veterans.
Substance Abuse Treatment for Teens
More than 1 out of 7 youths abused substances in 2013
Over 15%
Binge Drinking
8.1%
Illicit Drug Usage
In 2013, over 15% of Illinois youth participated in binge drinking. 8.1% used illicit drugs in that same year. To help overcome the obstacles that youth can face in overcoming substance addiction, some treatment facilities offer teen-specific programs. Our database has a filter that allows you to find the closest rehabs that provide that treatment option.
Additional Resources for Parents and Teachers
Use the following resources to get a better understanding of three of the biggest dangers to youth: prescription drug abuse, underage drinking, and marijuana use. The Illinois Department of Human Services offers general addiction facts for the state.
Co-Occurring Mental Health & Substance Abuse Treatment
In many cases, substance abuse and mental issues exist together. The proper term for it is “co-occurring mental and substance use disorders.” The Substance Abuse and Mental Health Services Administration (SAMHSA) estimates 39% of people with a substance abuse disorder have a co-occurring mental disorder, and 18% of people with an existing mental illness also have a substance abuse disorder.
Mental Health Resources & Treatment
If you or someone you love is suffering from mental health issues such as depression, PTSD, eating disorders, or severe anxiety there are many resources and ways to get help.
Below are a few quick ways to get immediate help, as advised from MentalHealth.gov:
- Emergency Services: If your life (or someone else’s life) is in danger, always start by dialing 911 to get immediate access to emergency services.
- Suicide Prevention: The number for the National Suicide Prevention Lifeline is: 800-273-8255. You can also initiate a private live online chat.
- Veterans Crisis Line: Dial 800-273-8255 to talk to someone immediately. You can also access help with a private online chat, or you can text 838255.
For those who need mental health help but don’t have an immediate need, the Illinois Department of Human Services (IDHS) has a page dedicated to helping the general public with mental health concerns.
Those who have mental health issues and a substance abuse problem may benefit from dual-diagnosis rehabs. Use the appropriate filter in our tool above to find rehab centers with programs designed to meet the unique challenge posed by co-occurring disorders.
Finding Aftercare in Illinois
Aftercare is both one of the most crucial steps of rehabilitation and one of the most overlooked. Those who skip aftercare and immediately adjust to “normal life” are at a much higher risk of relapsing than those who transition to an aftercare program. There are several types of aftercare including follow-up visits for continued therapy, group therapy, and sober living homes.
12-Step Addiction Meetings in Illinois
Alcoholics Anonymous (AA) designed the 12-step process for those recovering from an alcohol addiction, and today there are many other 12-step programs for other addictions and issues – Narcotics Anonymous (NA) is one only one example.
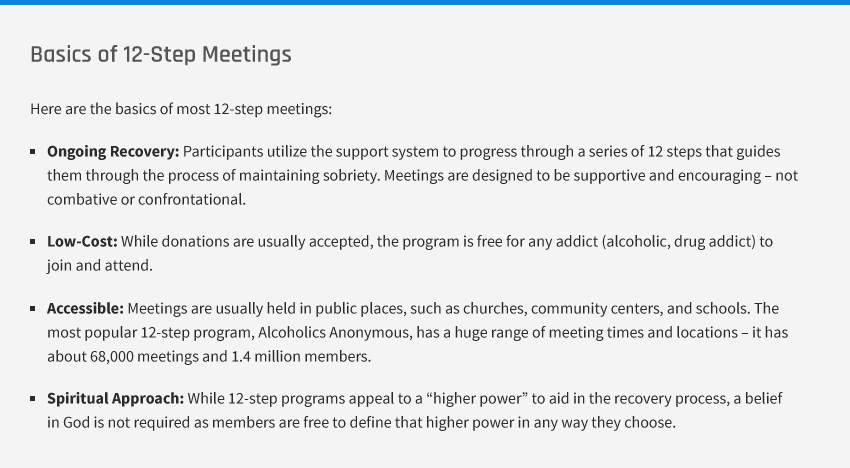
Use our 12-step meeting tool to find an AA or NA location near you
The tool below lists the contact information for local organizations that will connect you to Alcoholics Anonymous (AA) or Narcotics Anonymous (NA) meetings near you. Since the time and location of many meetings change periodically, any list of actual meetings online is likely outdated. Contacting the local organizations that coordinate the meetings will ensure that the information you receive is accurate and current.
| Name | City | Program | Telephone | Spanish Hotline |
|---|
Sober Living Homes
Sober living homes (also referred to as recovery residences) are group homes that help recovering addicts transition from treatment facilities to living on their own, while maintaining sobriety. They are especially helpful for those who don’t have a supportive and positive environment to live in after rehab.
Residents can stay for a couple months of for years, as long as they follow the rules and don’t relapse (most homes have a zero tolerance policy for using substances). Other rules usually include completing chores, attending mutual support groups regularly, and paying an equal share of the cost of renting the home.
Some halfway houses are listed in our database, and you can find them by using the appropriate filter in our tool above. Otherwise, head to our guide on sober living homes to learn more about sober living homes, and to find a certified recovery residence near you.
Substance Abuse in Illinois
Overview
Drug and alcohol induced deaths occur at a relatively low rate in Illinois
10.41%
of Illinois deaths are caused by drugs and alcohol
13%
of US deaths are caused by drugs and alcohol
According to the table below, the number of deaths caused, or partially caused by drugs and alcohol from 2006 to 2015 is 10.41%, well below the national average of 13.36%. In fact, Illinois ranked lower than the national averages in all three categories of drug and alcohol-induced deaths.
Deaths Caused by Drugs and Alcohol in Illinoiss Between 2006 and 2015
| Ages: 12-17 | Ages: 18+ | All Ages | |
| Drug-Induced Deaths | 106 | 102,947 | 103,088 |
| Alcohol-Induced Deaths | 22 | 15,774 | 15,799 |
| Total Deaths | 3,230 | 1,124,890 | 1,142,297 |
| Percentage of Drug & Alcohol Induced Deaths | 3.96% | 10.55% | 10.41% |
Amphetamines are treated at half the rate in Illinois than the rest of the United States
4.4%
of Illinois rehab admissions are for meth
9%
of US rehab admissions are for meth
Admissions to state-funded rehabs in Illinois due to amphetamine abuse is less than half as common (4.4%) than the rest of the country (8.9%). Prescription painkillers and other opiates were also responsible for significantly lower admissions in Illinois compared to the rest of the nation. However, heroin, marijuana, and cocaine were all connected to rehab admissions at noticeably higher percentages than the rest of the country.
Admission into State-Funded Treatment Programs in 2015
| Total Admissions in Illinois | Percent of all Admissions in Illinois | Percent of All Admissions in the US | |
| All Substances | 150,679 | 100% | 100% |
| Alcohol (Including Alcohol Usage with Secondary Drug) | 6,538 | 30.7% | 33.9% |
| Heroin | 6,410 | 30.1% | 25.4% |
| Marijuana | 4,427 | 20.8% | 14.1% |
| Cocaine (Including smoked and other usage) | 1,598 | 7.5% | 5.0% |
| Other Opiates (Including Prescription Painkillers) | 985 | 4.6% | 8.2% |
| Amphetamines (Including Methamphetamines) | 934 | 4.4% | 8.9% |
| Tranquilizers | 153 | 0.7% | 0.9% |
| Other/Unknown | 72 | 0.3% | 3.0% |
| Hallucinogens | 47 | 0.2% | 0.1% |
| PCP | 44 | 0.2% | 0.3% |
| Sedatives | 23 | 0.1% | 0.2% |
| Inhalants | 14 | 0.1% | 0.0% |
| Other Stimulants | 19 | 0.1% | 0.1% |
Key Indicators of Substance Abuse Issues
When trying to understand the substance abuse problem in a specific area, researchers and policymakers examine “key indicators.” Combined with usage stats, key indicators can provide a deep level of insight into which substances and demographics present the biggest problem and are at the highest risk. Key indicators with recent, credible statistics available are examined below.
12.23% of Illinoisans struggle with mental health issues
Based on data from The Substance Abuse and Mental Health Services Administration (SAMHSA), 18% of those with some form of mental health illness also have a substance use disorder, and 41% of those with a substance use disorder also have a mental health disorder. The combination of the two issues is called a “dual diagnosis.” Because of the link between the problems, statistics on mental health problems helps us to better understand substance abuse in Illinois.
12%
of Illinoisans have mental health problems
13.5%
of Americans have mental health problems
Mental illnesses afflict 12.23% of people in Illinois, which is slightly lower than the national average of 13.55%. Additionally, 2.94% of Illinoisans had seriously considered suicide compared to the higher national average of 3.99% of people 18 and older.
Illinois Annual Averages for Mental Health Issues in 2014 and 2015
| Ages: 12-17 | Percentage of Population | Ages: 18+ | Percentage of Population | |
| Major Depressive Episode | 115,000 | 0.90% | 581,000 | 4.50% |
| Serious Mental Illness | No Data | No Data | 343,000 | 2.67% |
| Any Mental Illness | No Data | No Data | 1,570,000 | 12.23% |
| Had Serious Thoughts of Suicide | No Data | No Data | 378,000 | 2.94% |
A direct indicator of severe mental health problems, suicide is an act that’s often linked with substance abuse – those who have a Substance Use Disorder (SUD) are six times more likely to attempt suicide during their lifetime than those without an SUD. Compared to the other states, Illinois ranked 45th for the number of suicides, averaging 9.6 suicides per 100,000 people.
Suicides in Illinois Between 2006 and 2015
| Suicides in Illinois | Suicides Rank | Illinois Suicide Rate (Per 100k People) | Suicide Rate Rank | U.S. Suicide Rate (Per 100k People) | |
| Ages: 12-17 | 384 | 8th | 3.6 | 42nd | 4.2 |
| Ages: 18+ | 11,901 | 9th | 12.2 | 45th | 16 |
| Total | 12,307 | 8th | 9.6 | 45th | 12.5 |
DUI deaths in Illinois are slightly below the national average
All too often, individuals choose to get behind the wheel of a car after using alcohol or drugs. Statistics involving arrests and crashes due to drugs and alcohol give direct insight into the substance abuse problem in the state.
2.5
deaths per 100,000 people involving intoxicated Illinois drivers ages 21-34
3.3
deaths per 100,000 people involving intoxicated US drivers ages 21-34
According to the Centers for Disease Control and Prevention (CDC), 2.2% of Illinois drivers report driving after drinking too much, which is slightly higher than the national average of 1.9%. However, as the table below shows, the average of DUI-related deaths in Illinois is 2.5 per 100,000 — slightly below the 3.3 per 100,000 national average.
Deaths Involving Drivers Under the Influence of Alcohol in 2012
| Ages: 0-20 | Ages: 21-34 | Ages: 35+ | All Ages | |
| Illinois Rate of Deaths (per 100,000) | 0.7 | 6.0 | 2.1 | 2.5 |
| United States Rate of Deaths (per 100,000) | 1.3 | 6.7 | 3.1 | 3.3 |
The table below shows statistics on fatal crashes related to driving under the influence of alcohol in Illinois. According to data, 2012 had the most alcohol-related crash fatalities with 393, which was 41% of all crash fatalities that year.
Illinois DUI Statistics from 2010 to 2014
| 2010 | 2011 | 2012 | 2013 | 2014 | |
| Total Crash Fatalities | 957 | 918 | 956 | 991 | 924 |
| Total Alcohol-Related Crash Fatalities | 354 | 323 | 393 | 389 | 369 |
| Percent Alcohol-Related |
27% | 35% | 41% | 39% | 40% |
Opioid painkillers in Illinois are prescribed at a relatively low rate
Prescription drug abuse (particularly opioid painkillers and Benzodiazepines) is an increasing problem in the United States. While it is difficult to estimate how many people use these drugs as prescribed and how many abuse them, the CDC and IMS have researched the variation in painkiller prescriptions between states. The more prescriptions are written, the greater the potential for dependence and abuse.
67.9
opioid pain reliever prescriptions written per 100 people in Illinois
87.3
opioid pain reliever prescriptions written per 100 people in the US
Illinois ranks near the bottom for the number of prescriptions written in 2012 in every category except for Benzodiazepines. Out of 51 states (and Washington D.C.), Illinois ranked 50th for the number of long-acting/extended release and high-dose opioid pain relievers prescribed. It ranked 43rd in general opioid painkillers prescribed and 34th in benzodiazepines.
Painkiller Prescriptions in Illinois per 100 People in 2012
| Illinois | National Average | State Rank | |
| Opioid Pain Relievers | 67.9 | 87.3 | 43 |
| Long-Acting/Extended-Release Opioid Pain Relievers | 5.5 | 12.0 | 50 |
| High-Dose Opioid Pain Relievers | 2 | 4.5 | 50 |
| Benzodiazepines | 34.2 | 39.2 | 34 |
Illinois has a significantly lower number of homeless people than the rest of the country
A high homelessness rate in an area can often be an indication of potential substance abuse issues. SAMHSA shows that homelessness can either cause or be caused by a substance abuse problem.
Overall, Illinois has a considerably lower number of homeless people compared to the rest of the United States, and that number has dropped from 2015 to 2016. In 2016, Illinois had an average of 9 homeless people per 10,000, compared to the national average of 17.
Substance Abuse Among At-Risk Groups
“At-Risk Groups” are segments of the population who are especially vulnerable to developing a substance abuse problem, or those who have a higher likelihood of negative outcomes. While there are several different demographics that fit into this category (such as pregnant women and veterans), the only recent statistics in the state of Illinois have to do with youth. Youth are considered “at-risk” because the effect of substance-abuse on their still-developing brain is more extreme than with older addicts.
Compared to the national average, youths in Illinois binge alcohol at a higher rate, but use illicit drugs at a lower rate
8%
of Illinois youth used illicit drugs in 2013
9%
of US youth used illict drugs in 2013
12 to 17 year-olds in Illinois abused drugs at a rate of 8.1% in 2013, which was lower than the national average of 9.2%. However, year after year the binge alcohol rate in Illinois has been higher than the national average.
Substance Abuse Among Youth
| Illicit Drug Use in Illinois | Illicit Drug Use in the U.S. | Binge Alcohol Use in Illinois | Binge Alcohol Use in the U.S. | |
| 2009 – 2010 | 10.2% | 10.1% | 19.6% | 17.5% |
| 2010 – 2011 | 9.7% | 10.1% | 17.8% | 16.3% |
| 2011 – 2012 | 8.7% | 9.8% | 16.5% | 15.6% |
| 2012 – 2013 | 78.1% | 9.2% | 15.4% | 14.7% |
SAMHSA’s Behavioral Health Barometer – Illinois, 2014
Regional Substance Abuse Statistics & Rehabs
The following sections take a deeper look at the substance abuse problems in Illinois by examining key indicators in the three largest cities in the state. We’ve also listed the three highest-rated rehabs that offer some sort of payment assistance in or around each city.
Chicago
The three highest rated rehabs in Chicago that offer payment assistance are listed in the table below, along with each institution’s performance on our core metrics.
The Highest-Rated, Low-Cost Rehabs in Chicago
| Behavioral Services Center – Chicago Loop Campus | ABRAXAS Youth and Family Services – Southwood Interventions | Trilogy Inc | |
| Rehabilitation Services Provided | 10 | 6.64 | 9.13 |
| Treatment Approaches | 10 | 8.75 | 5 |
| Cost | 6.66 | 6.66 | 3.33 |
| Special Programs for Unique Demographics | 6.64 | 3.32 | 0.83 |
| Ancillary Services | 9.5 | 8.74 | 8.74 |
| Total Score | 8.8 | 6.9 | 5.7 |
Deaths from drugs and alcohol in Chicago occur at a lower rate than the state and national average
8.89%
of deaths in Chicago are caused by drugs and alcohol
10.41%
of Chicago deaths are caused by drugs and alcohol
In Chicago, the percentage of deaths due to drugs and alcohol is 8.89%, which is lower than the national average (13.36%), the state average (10.41%), and the other two cities we researched.
Drug and Alcohol-Induced Deaths in Cook County Between 2006 and 2015
| Ages: 12-17 | Ages: 18+ | All Ages | |
| Drug-Induced Deaths | 27 | 32,325 | 32,371 |
| Alcohol-Induced Deaths | N/A | 6,437 | 6,445 |
| Total Deaths | 1,410 | 428,492 | 436,462 |
| Percentage of Drug & Alcohol-Induced Deaths | 2.48% | 9.05% | 8.89% |
Homelessness in Chicago has dropped since 2012
According to data from the Department of Housing and Urban Development (HUD), both sheltered and unsheltered homelessness have dropped from 2012 to 2016, with unsheltered homelessness spiking in 2015 before taking a steep decline. The rate of homeless veterans dropped from 2015 to 2016, but is up overall from 2012.
Homelessness in Chicago
| 2012 | 2013 | 2014 | 2015 | 2016 | |
| Sheltered Homeless |
4,988 | 5,060 | 5,328 | 4,731 | 4,646 |
| Unsheltered Homeless | 1,722 | 1,216 | 959 | 2,055 | 1,243 |
| Homeless Veterans |
520 | 712 | 714 | 752 | 601 |
| Total Homeless |
6,710 | 6,276 | 6,287 | 6,786 | 5,889 |
Source: HUD Exchange
See our full-length guide to rehab in Chicago for more information.
Rockford
The three highest rated rehabs near Rockford that offer payment assistance are listed in the table below, along with each institution’s performance on our core metrics.
The Highest-Rated, Low-Cost Rehabs Near Rockford
| Sinnissippi Centers Inc – Rochelle Office | Sinnissippi Centers Inc – Mt. Carroll Office | Braden Counseling Center PC | |
| Rehabilitation Services Provided | 6.64 | 6.64 | 0.83 |
| Treatment Approaches | 5 | 3.75 | 3.75 |
| Cost | 6.66 | 6.66 | 3.33 |
| Special Programs for Unique Demographics | 0 | 0 | 0 |
| Ancillary Services | 4.18 | 5.32 | 2.28 |
| Total Score | 5.0 | 4.8 | 2.1 |
Rockford has a higher rate of drug and alcohol-induced deaths than the state
11.79%
of Rockford deaths are caused by drugs and alcohol
10.41%
of Illinois deaths are caused by drugs and alcohol
The rate of alcohol and drug-related deaths in Rockford is higher than the 10.41% state average, but lower than the national average of 13.36% with a rate of 11.79% amongst all ages.
Drug and Alcohol-Induced Deaths in Winnebago County Between 2006 and 2015
| Ages: 12-17 | Ages: 18+ | All Ages | |
| Drug-Induced Deaths | N/A | 3,034 | 3,043 |
| Alcohol-Induced Deaths | N/A | 528 | 529 |
| Total Deaths | 98 | 29,853 | 30,301 |
| Percentage of Drug & Alcohol Induced Deaths | 10.2% | 11.93% | 11.79% |
Rockford’s homelessness rate has dropped significantly from 2012 to 2016
According to the data below, the rate of homelessness in Rockford has taken a staggering drop from 2012 to 2016, decreasing from 727 to 255 total homeless people. In fact, the number has dropped in every category, including homeless veterans.
Homelessness in Winnebago County
| 2012 | 2013 | 2014 | 2015 | 2016 | |
| Sheltered Homeless |
525 | 501 | 379 | 298 | 207 |
| Unsheltered Homeless | 202 | 287 | 31 | 29 | 48 |
| Homeless Veterans |
88 | 45 | 16 | 20 | 13 |
| Total Homeless |
727 | 788 | 410 | 327 | 255 |
Source: HUD Exchange
Peoria
The table below shows the three highest rated treatment centers that offer payment assistance in or near Peoria, along with each institution’s performance on our core metrics.
The Highest-Rated, Low-Cost Rehabs Near Peoria
| Chestnut Health Systems Inc Adult Chemical Dependency Services | Bridgeway Inc – Kewanee | Bridgeway Inc – Monmouth | |
| Rehabilitation Services Provided | 3.32 | 1.66 | 1.66 |
| Treatment Approaches | 6.25 | 5 | 1.25 |
| Cost | 5.55 | 5.55 | 5.55 |
| Special Programs for Unique Demographics | 4.15 | 0.83 | 0.83 |
| Ancillary Services | 7.6 | 2.66 | 2.28 |
| Total Score | 5.1 | 3.2 | 2.3 |
Peoria’s drug and alcohol-related deaths are lower than both the state and nation’s averages
8.69%
of Peoria deaths are caused by drugs and alcohol
13.5%
of Illinois deaths are caused by drugs and alcohol
Peoria has a drug and alcohol-induced death rate of 8.69% amongst all ages, which is much lower than the state average of 11.79% and the national average of 13.36%.
Drug and Alcohol-Induced Deaths in Peoria County Between 2006 and 2015
| Ages: 12-17 | Ages: 18+ | All Ages | |
| Drug-Induced Deaths | N/A | 2,047 | 2,048 |
| Alcohol-Induced Deaths | N/A | 337 | 338 |
| Total Deaths | 44 | 19,663 | 19,978 |
| Percentage of Drug & Alcohol-Induced Deaths | N/A | 8.72% | 8.69% |
With a little fluctuation, homelessness in Peoria has stayed relatively the same over the past five years
With the number rising from 2012 to 2015, the number of overall homeless people in Peoria has dropped back down to 378 in 2016, just two higher than in 2012. The number of sheltered and veteran homeless people have dropped over the last five years, but the number of unsheltered homeless has sharply risen from 9 to 70.
Homelessness in Peoria County
| 2012 | 2013 | 2014 | 2015 | 2016 | |
| Sheltered Homeless |
367 | 370 | 379 | 383 | 308 |
| Unsheltered Homeless | 9 | 26 | 26 | 68 | 70 |
| Homeless Veterans |
22 | 26 | 10 | 29 | 12 |
| Total Homeless |
376 | 396 | 405 | 451 | 3785 |
Source: HUD Exchange
Find Rehab in Illinois
Take Action
Substance abuse treatment is available for anyone who needs help in Illinois – you don’t have to struggle alone. To get help, determine your insurance coverage, then use our tool below to contact a rehab center near you to schedule an assessment. Remember, many low-cost rehab centers can help if you don’t have insurance coverage or feel that rehab is out of the question due to financial constraints.
Treatment for substance abuse is available for anyone who needs help in the state of Illinois. To find help, use the steps laid out in this guide, starting with determining your insurance coverage. After that, use our tool below to contact a treatment center in your area to schedule a professional assessment. If you feel that finances may be an issue, there are many low-cost rehab centers that can assist in getting you the help you need. Most importantly, remember that you don’t have the struggle with addiction alone. Help for anyone suffering with substance abuse in Illinois can be found.