Between 2014 and 2017, 8% of Michigan adolescents aged 12-17 reported engaging in marijuana use in the past month, which was above the national average of 6.8%. A further 10.8% of Michigan adolescents aged 12-17 had consumed alcohol in the past month, only marginally above the national average of 10.1%. Additionally, 1.8% of individuals admitted to a substance abuse treatment program in Michigan in 2017 were aged 12-17.
Drug & Alcohol Addiction Rehab, Treatment & Recovery Resources in Michigan
TABLE OF CONTENTS
Getting Help
What to Consider When Choosing a Rehab Center
There are many different types of rehab programs and treatment options to consider. Here are a few of the decisions you need to make:
- Service Setting: Will you be considering residential inpatient programs or outpatient programs?
- Specialized Rehabs: Are you interested in holistic rehabs or rehabs for dual diagnosis, or just alcohol and drug detox?
- Rehab Lengths: Are you looking for a shorter rehab length (30 days) or a longer-term option (60, 90, or 120+ days)?
The main factors that determine which rehab options will be best for you are the severity of your addiction and your unique personal and financial situation.
For more information on how to make all of these decisions, read our guide to Choosing the Right Rehab
The Highest Rated, Low-Cost Rehabs in Michigan
If the cost of rehab is a barrier for you – as it is for many – and you don’t have insurance, there are still ways for you to receive help. According to the Substance Abuse and Mental Health Administration (SAMHSA), there are 428 substance abuse treatment centers in the state of Michigan. Of those 428 centers, Cherry Health Heart of the City Health Center in Grand Rapids received the highest overall score based on our five core metrics.
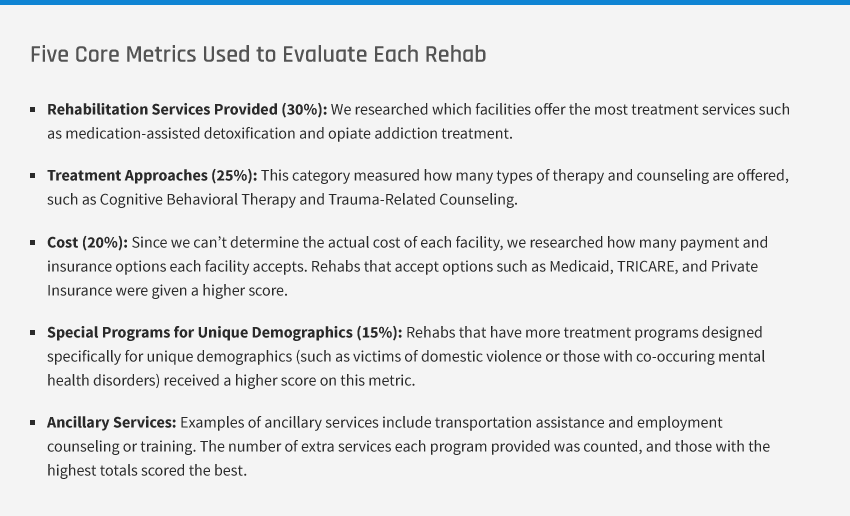
For more information about the five core metrics, head to the full breakdown of our filtering process and ranking methodology
1. Cherry Health Heart of the City Health Center
Located in Grand Rapids, Cherry Health Heart of the City Health Center earned the highest overall score in our rankings of 7.6 points out of 10 points and provides outpatient rehabilitation services to adolescents, young adults, and adults. It received the highest score in the category of Rehabilitation Services Provided due to its detoxification and relapse prevention services and its utilization of buprenorphine and naltrexone in treatment. Additional forms of assistance such as housing services, employment counseling and training, mental health assessments, and many more also earned it a high score for the ancillary services it offers to its clients. Treatment approaches were a further area of strength for the center and include cognitive behavioral therapy, the Matrix Model and 12-step facilitation approaches, anger management, and motivational interviewing/incentives, among several others. In terms of cost, the center accepts Medicare, Medicaid and other state-financed health insurance, TRICARE, private health insurance, and self-payment as payment options. It earned minimal points for its special programs for unique populations — these are available only to individuals who have experienced trauma and with co-occurring mental health disorders.
- Rehabilitation Services Provided: 10
- Treatment Approaches: 7.77
- Cost: 7.5
- Special Programs for Unique Demographics: 1.82
- Ancillary Services: 8.74
2. Recovery Pathways, LCC - Gladwin
The Gladwin location of Recovery Pathways, LCC offers outpatient and computerized treatment services to young adults and adults and received an overall score of 6.9 points out of 10 points. The center earned a perfect score for its rehabilitation services, which include medication-assisted treatment, maintenance, and relapse prevention using buprenorphine and naltrexone. Its second-highest score was for its variety of ancillary services — it offers domestic violence services, HIV/AIDS education and support, employment counseling and training, and transportation assistance, among many other supportive services. Medicare, Medicaid and other state-financed health insurance, government funding for substance abuse programs, private health insurance, and self-payment can be used to cover the costs of treatment, and a sliding fee scale based on income and other factors is also available. The center’s fewest points were for its limited special programs for unique populations; however, it does offer custom-tailored programs for pregnant/postpartum women and clients referred from the court system.
- Rehabilitation Services Provided: 10
- Treatment Approaches: 5.55
- Cost: 6.25
- Special Programs for Unique Demographics: 3.64
- Ancillary Services: 6.84
3. Recovery Pathways, LLC - Corunna
The Recovery Pathways, LLC location in Corunna also offers treatment in outpatient and computerized settings to young adults and adults and earned the same score as the Gladwin location of 6.9 out of 10 points. Its greatest strength was its rehabilitation services, providing clients with medication-assisted treatment, maintenance, and relapse prevention services utilizing buprenorphine and naltrexone. Given its wealth of ancillary services, clients can receive complementary care in the areas of social services assistance, tobacco cessation counseling, individual/group/marital/family counseling, aftercare services, and many more. It had a slightly lower score in the category of Cost; however, it does accept Medicare, Medicaid and other state-financed health insurance, government funding for substance abuse programs, private health insurance, and self-payment as payment options, in addition to employing a sliding fee scale based on income and other factors. Its lowest-performing category was its special programs for unique populations, which are limited to clients referred from the court system and pregnant/postpartum women.
- Rehabilitation Services Provided: 10
- Treatment Approaches: 5.55
- Cost: 6.25
- Special Programs for Unique Demographics: 3.64
- Ancillary Services: 6.84
Highest-Rated, Low-Cost Treatment Centers in Michigan
| Rank | Rehab | Total Score | Contact Information |
| #1 | Cherry Health Heart of the City Health Center | 7.6 | 100 Cherry Street SE Grand Rapids, MI 49503 Main Tel: 616-965-8200 |
| #2 | Recovery Pathways, LCC – Gladwin | 6.9 | 655 East Cedar Avenue Gladwin, MI 48624 Main Tel: 989-928-3566 |
| #3 | Recovery Pathways, LLC Corunna | 6.9 | 211 North Shiawassee Street, Suite A Corunna, MI 48817 Main Tel: 989-494-0404 |
| #4 | Van Buren Community Mental Health Resource Center Paw Paw Family Resource Center | 6.9 | 801 Hazen Street, Suite C Paw Paw, MI 49079 Main Tel: 269-657-5574 |
| #5 | Detroit Central City Integrated Health | 6.9 | 10 Peterboro Street Detroit, MI 48201 Main Tel: 313-831-3160 |
| #6 | CNS Healthcare Waterford Office | 6.5 | 279 Summit Drive Waterford, MI 48328 Main Tel: 248-745-4900 |
| #7 | Munson Medical Center Intensive Outpatient Treatment | 6.3 | 1105 Sixth Street Traverse City, MI 49684 Main Tel: 231-935-6382 Intake Tel: 800-662-6766 |
| #8 | Community Care Services Dual Diagnosis & Horizon’s Assertive Community Treatment (ACT) | 6.1 | 26180 West Outer Drive Lincoln Park, MI 48146 Main Tel: 313.389.7500 |
| #9 | Ascension Eastwood Behavioral Health at Woodward | 5.9 | 30701 Woodward Avenue, #200 Royal Oak, MI 48073 Main Tel: 208-288-9333 |
| #10 | Catholic Charities of Shiawassee and Genesee Counties | 5.4 | 1480 North M-52, Suite 1 Owosso, MI 48867 Main Tel: 989-723-8239 |
Finding a Substance Abuse Treatment Center in Michigan
Start by contacting your referral center
There are seven Michigan 211 centers across the state, and each provides referrals to substance abuse services within its specific region. A map of the seven service regions and instructions for contacting a Michigan 211 center that serves a particular location are available on the Michigan 211 website. Individuals can also search the Michigan 211 database of mental health and substance abuse resources by first choosing a service type and then entering their location within the state. Results will list local agencies and their services, including the Access Management System (AMS) agency for the selected area.
AMS agencies are publicly-funded organizations that refer individuals to providers that use a sliding fee scale for their services. To be eligible for payment assistance, residents must have either Healthy Michigan, Medicaid, or MI Health Link insurance or else have limited or no insurance coverage. However, residents who do not qualify based on their income or other factors may still receive referrals to other community service providers.
As an additional resource, the Michigan Department of Technology, in partnership with the Department of Licensing and Regulatory Affairs, has created a map for residents that shows the locations of all substance abuse agencies, facilities, and programs that are licensed and regulated by the state. After users select the “Substance Use Disorder Care” option, icons will appear on the map at locations where substance abuse services are provided. Clicking on an icon will create a pop-up box listing the name, address, county, facility type, and specialties for that specific location.
Individuals with a substance abuse disorder who need additional support can also join the Michigan State Police (MSP) Angel Program, available at every MSP post in the state of Michigan. Joining is simple — individuals visit a police station during regular hours of operation to request assistance and are accepted as long as they meet admission criteria. As members of the program, individuals receive guidance during professional substance abuse assessment and intake processing, as well as transportation to and from treatment.
Recovering from substance abuse can be expensive. Medicaid services can help low-income Michigan residents cover the costs of treatment. Visit the Michigan Medicaid and CHIP website for further information about eligibility.
Use our database to find a treatment center near you
The tool below lists all of the treatment centers in the state of Michigan recognized by the Substance Abuse and Mental Health Services Administration (SAMHSA). Input your zip code and select the filter icon to find relevant treatment centers near you.
Find a Rehabilitation Facility Near You

Filter Your Search
Popular Searches
Type Of Care
Treatment Approaches
Service Setting
Age Groups Accepted
Ancillary Services
Facility Operation
Facility Smoking Policy
Gender Accepted
Language Services
License Certification Accreditation
Payment Assistance Available
Payment Methods and Insurance Accepted
Special Programs Groups Offered
What to Expect in Rehab
Many different methods are available for treating addiction, and the science of studying addiction is constantly improving and changing. However, the core pieces of rehabilitation are generally very similar.
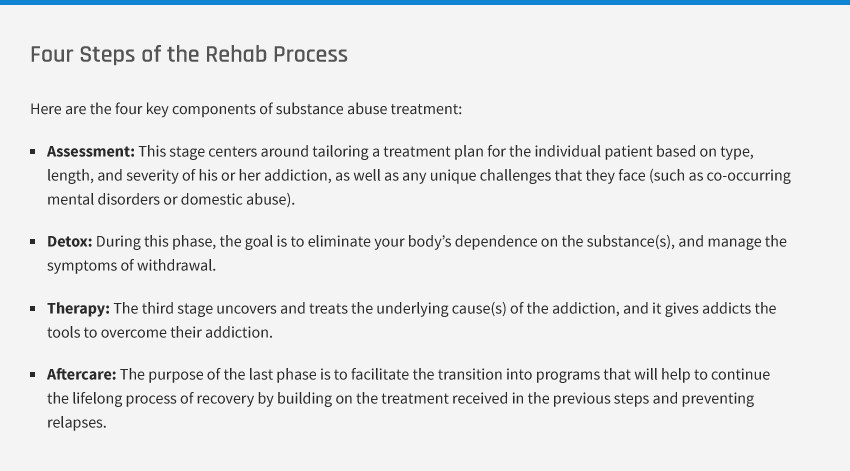
For more on what to expect in rehab, read our guide on the addiction rehabilitation process.
Substance Abuse and Rehab for At-Risk Groups
Substance Abuse Treatment for Veterans
Around 40% of Michigan’s homeless veterans have a substance abuse disorder
According to the Michigan Statewide Homeless Management Information System, 3,734 homeless veterans lived in the state of Michigan in 2017, and 73% of these homeless veterans suffered from a long-term disability. Their disabilities were also grouped by category: 59% of homeless veterans had a mental health condition, 57% had a physical health condition, 40% had a substance abuse disorder, 36% had a chronic health condition, and 3% had a developmental disability.
Long-Term Disabilities Among Homeless Veterans in Michigan, 2017
Veterans in Michigan can reach out to their local VA medical center to search for information on substance abuse treatment, including the possibility of a VA-based substance use disorder (SUD) program, in their state. Additionally, they can locate information regarding substance abuse treatment services on the Michigan Veterans Affairs Agency website or by reaching out to a Veteran Navigator near them for further assistance connecting with resources.
Treatment is available for veterans in Michigan who are suffering from a substance use disorder. As of 2017, 91 substance abuse treatment facilities in Michigan – representing 20% of all treatment facilities – catered specifically to veterans.
For more information, read our guide on Substance Abuse Rehab for Veterans.
Substance Abuse Treatment for Adolescents
Adolescents in Michigan use marijuana and alcohol at rates above the national average
8%
of adolescents aged 12-17 used marijuana, 2014-2017
10.8%
of adolescents aged 12-17 drank alcohol, 2014-2017
Additional Resources for Parents and Teachers
You can seek out the following resources from the Substance Abuse and Mental Health Services Administration (SAMHSA) and the National Institute on Drug Abuse (NIDA) to gain a better understanding of three of the biggest substance abuse dangers to youth: prescription drug abuse, underage drinking, and marijuana use. Furthermore, check out these NIDA links for teens and parents/teachers about the dangers of substance abuse.
Co-Occurring Mental Health & Substance Abuse Treatment
Substance abuse and mental health issues tend to go hand-in-hand – the technical term is “co-occurring substance use and mental health disorders.” The Substance Abuse and Mental Health Services Administration (SAMHSA) reported that, in 2017, 45.6% of adults with a substance use disorder also had a mental health disorder, and 18.3% of adults with a mental health disorder also had a substance use disorder. For adolescents in 2017, 35.9% of those with a substance use disorder also had a major depressive episode, while 10.7% of adolescents with a major depressive episode also had a substance use disorder.
Mental Health Resources & Treatment
If you or someone you love is suffering from mental health issues, such as depression, PTSD, eating disorders, or severe anxiety, there are many resources from which to receive help.
Below are a few ways to receive immediate assistance, as advised by MentalHealth.gov:
Emergency Services: If your life (or someone else’s life) is in danger, always start by dialing 911 to gain immediate access to emergency services.
Suicide Prevention: The number for the National Suicide Prevention Lifeline is: 800-273-8255. You can also initiate a private live online chat.
Veterans Crisis Line: Dial the National Suicide Prevention Lifeline at 800-273-8255 and press “1” to talk to someone immediately. You can also access help with a private online chat or text 838255.
Here are two ways to find a provider of mental health treatment in Michigan:
Michigan Department of Health & Human Services: This site has a searchable database of mental health providers.
Michigan National Alliance on Mental Illness (NAMI): The NAMI Michigan website has a special section devoted to descriptions of NAMI programs. These include the NAMI Basics Education Program designed for caregivers of children and adolescents with a mental illness.
Individuals who have both substance use and mental health disorders may benefit from dual-diagnosis rehab facilities. Use the appropriate filter in our tool above to find rehabilitation centers with treatment programs designed to meet the unique challenges posed by co-occurring substance use and mental health disorders.
Finding Aftercare in Michigan
Substance abuse aftercare treatment is often overlooked, but it’s one of the most crucial steps in the rehabilitation process. The chances of relapsing after rehab dramatically rise for individuals who try to resume their lives without pursuing further treatment in an aftercare setting. Several different types of aftercare are available for recovering addicts, including follow-up visits for continued therapy, group therapy, and sober living homes. Research shows that long-term participation in aftercare activities dramatically improves the outcome of rehabilitation efforts.
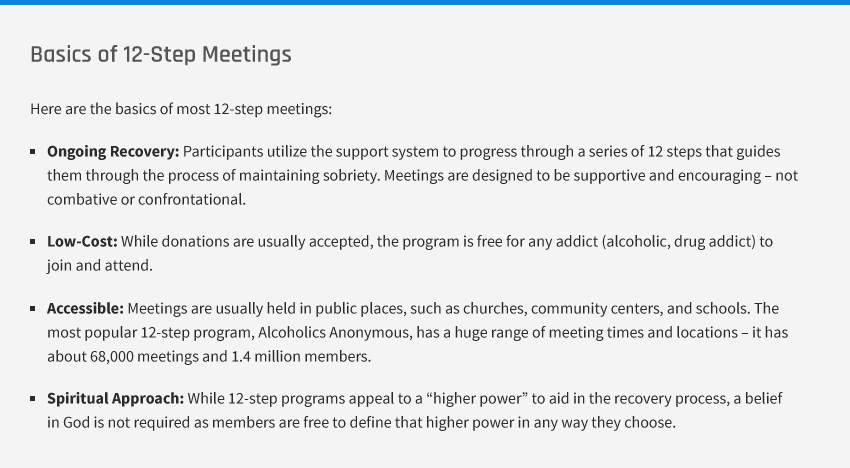
12-Step Addiction Meetings in Michigan
Alcoholics Anonymous (AA) designed the 12-step process for individuals recovering from alcohol addiction, and today there are many other 12-step programs for other addictions and issues – Narcotics Anonymous (NA) being just one example.
Contact the appropriate local organization to find an AA or NA meeting near you
The tool below lists the contact information for local organizations that will connect you to Alcoholics Anonymous (AA) or Narcotics Anonymous (NA) meetings near you. Since meeting times and locations change periodically, contact the local groups that coordinate the meetings to ensure that the information is up to date.
| Name | City | Program | Telephone | Spanish Hotline |
|---|
Sober Living Homes
Sober living homes (also referred to as recovery residences) are group homes that help recovering addicts transition from treatment facilities to living independently while maintaining their sobriety. These homes can be especially beneficial for individuals who don’t have a supportive and positive environment in which to live after leaving a rehabilitation facility.
Residents of sober living homes can stay from a few months to several years, as long as they follow house rules and avoid relapse, as these homes typically have a zero-tolerance drug and alcohol policy. Additionally, residents are expected to complete chores, attend mutual support groups, and pay an equal share of the cost of renting the home.
Some sober living homes are listed in our database, and you can find them by using the appropriate filter in our tool above. You can also check out our guide on sober living homes to learn more about them and to find a certified recovery residence near you.
Substance Abuse in Michigan
Overview
The following table illustrates the annual estimates of substance abuse among residents of Michigan between 2016 and 2017, in addition to the percentage of the Michigan population and the U.S. population that those estimates represent.
Annual Estimates for Substance Abuse in Michigan, 2016-2017
| Ages: 12-17 | Ages: 18+ | Total Ages | % of Michigan Population | % of National Population | |
| Alcohol | 14,000 | 449,000 | 463,000 | 4.63% | 0.14% |
| Cocaine | 3,000 | 140,000 | 143,000 | 1.43% | 0.04% |
| Heroin | 0 | 26,000 | 26,000 | 0.26% | 0.01% |
| Marijuana | 109,000 | 1,297,000 | 1,406,000 | 14.07% | 0.43% |
| Methamphetamine | 1,000 | 33,000 | 34,000 | 0.34% | 0.01% |
| Prescription Opioid | 4,000 | 59,000 | 63,000 | 0.63% | 0.02% |
Source: 2016-2017 National Survey on Drug Use and Health State-Specific Tables, Table 81
* ‘Alcohol’ refers to an Alcohol Use Disorder. The numbers reflected in the table above are not the number of individuals who use alcohol, but rather those who have an AUD, defined as meeting the criteria for alcohol dependence.
* ‘Prescription opioid’ refers to a Pain Reliever Use Disorder. The numbers reflected in the table above are not the number of individuals who use or even occasionally misuse a prescription opioid, but rather those who have a PRUD, defined as meeting the criteria for illicit drug dependence.
16.6%
of Michigan deaths are caused by drugs and alcohol
12.71%
of U.S. deaths are caused by drugs and alcohol
The following table shows the number of deaths involving drugs and alcohol in Michigan between 2008 and 2017. The corresponding graph illustrates the percentage of deaths due to drugs and alcohol in Michigan compared to the national average.
Drug- and Alcohol-Induced Deaths in Michigan, 2008-2017
| 0-17 | 18+ | All Ages | |
| Drug-Induced Deaths | 154 | 163,792 | 163,946 |
| Alcohol-Induced Deaths | 19 | 17,609 | 17,628 |
| Total Deaths | 12,620 | 1,081,397 | 1,094,019 |
| Percentage of Drug & Alcohol-Induced Deaths | 1.37% | 16.77% | 16.6% |
Source: CDC Wonder
The following table details the number of admissions to state-funded treatment programs in Michigan in 2017, based on the primary substance for which the individual was seeking treatment.
Admissions to State-Funded Treatment Programs in Michigan by Primary Substance, 2017
| Total Treatment Admissions | % of All Treatment Admissions in Michigan | % of All Treatment Admissions in the U.S. | |
| All Substances | 78,645 | 100% | 4.11% |
| Alcohol (Including Alcohol Usage with Secondary Drug) | 28,456 | 36.2% | 1.49% |
| Amphetamines (Including Methamphetamines) | 2,243 | 2.9% | 0.12% |
| Cocaine (Including smoked and Other Usage) | 6,077 | 7.8% | 0.32% |
| Hallucinogens | 37 | 0% | <0.01% |
| Heroin | 24,405 | 31% | 1.28% |
| Inhalants | 60 | 0.1% | <0.01% |
| Marijuana | 7,053 | 9% | 0.37% |
| Other Opiates (Including Prescription Opioids) | 9,075 | 11.5% | 0.47% |
| Other Stimulants | 70 | 0.1% | <0.01% |
| Other/Unknown Substances | 128 | 0.2% | 0.01% |
| PCP | 4 | 0% | <0.01% |
| Sedatives | 202 | 0.3% | 0.01% |
| Tranquilizers | 835 | 1.1% | 0.04% |
Key Indicators of Substance Abuse Issues
When trying to understand substance abuse issues in a specific area, researchers and policymakers examine “key indicators.” Combined with usage statistics, key indicators can provide a deep level of insight into which substances present the most serious concerns and which demographics can be most impacted by substance abuse. Key indicators of substance abuse issues within the state of Michigan, along with recent, credible statistics, are examined below.
Over 1.4 million Michigan residents suffer from mental illness every year
As discussed earlier in this guide, there is a strong link between substance use disorders and mental health disorders. When an individual is afflicted with both of these issues at the same time, health professionals refer to it as co-occurring substance use and mental health disorders or a “dual diagnosis.” Consequently, the prevalence of mental health issues in a given state can also help us to understand the level of substance abuse.
4.6%
of Michigan adults had a serious mental illness
7.4%
of Michigan adults had a major depressive episode
From 2017-2018, 4.6% of Michigan adults were afflicted with a serious mental illness, which is on par with the national rate, which is also 4.6%. Among Michigan residents, 7.4% of adults suffered a major depressive episode in the past year, compared to a national average of 7.1%.
The table below sheds some light on the prevalence of mental health issues in Michigan.
Mental Health Issues in Michigan by Age and Percentage of Population, 2016-2017
| Ages: 12-17 | % of Michigan Population | Ages: 18+ | % of Michigan Population | |
| Major Depressive Episode | 107,000 | 1.07% | 546,000 | 5.46% |
| Any Mental Illness | No Data | No Data | 1,405,000 | 14.06% |
| Serious Mental Illness | No Data | No Data | 349,000 | 3.49% |
| Serious Thoughts of Suicide | No Data | No Data | 306,000 | 3.06% |
Source: 2016-2017 National Surveys on Drug Use and Health, Tables 27-28, 30-31
Suicide rates in Michigan are similar to the national average
The Centers for Disease Control reports that suicide is the leading cause of death in the United States. The suicide rate has risen in nearly every state from 1999 to 2016, with that rate increasing by more than 30% in half of all 50 states since 1999. Suicide is an act that is often linked to substance abuse. According to the U.S. Department of Health and Human Services, substance abuse is a primary risk factor for both adults and adolescents who attempt and/or complete suicide, and this is particularly true for at-risk populations.
Furthermore, the relationship between substance abuse and suicide is multi-faceted and complex. Persons who have substance abuse issues typically also carry other risk factors for suicide, including depression, impulsive behavior, and other struggles with relationships, finances, illness, or unemployment that make them more likely to engage in self-harm. Between 1999 and 2016, Michigan witnessed a 32.9% increase in the number of suicides. In 2017, Michigan ranked 36th in the country for the number of suicides per 100,000 residents.
Suicides and Suicide Rates in Michigan and the United States, 2017
| Suicides in Michigan | Suicide Rate Per 100,00 | Suicides in the U.S. | Suicide Rate Per 100,000 | |
| Ages 10-14 | 18 | 3.1 | 517 | 2.5 |
| Ages 15-24 | 194 | 14.2 | 6,252 | 14.5 |
| Ages 25-44 | 445 | 18.4 | 15,283 | 17.8 |
| Ages 45-64 | 550 | 20.2 | 16,543 | 19.6 |
| Ages 65-74 | 133 | 13.6 | 4,620 | 15.6 |
| Ages 75+ | 117 | 17.0 | 3,948 | 18.6 |
| All Ages | 1,457 | 14.6 | 47,163 | 14.5 |
Michigan has a significantly higher opioid prescribing rate than the U.S. rate
Prescription drug abuse – particularly in the form of opioids – has become an epidemic in the United States. While it is difficult to estimate how many individuals use these drugs as prescribed and how many abuse them, the Centers for Disease Control has researched the variation in opioid prescriptions between states, establishing a direct connection between an increased level of opioid prescriptions with a greater potential for dependence and abuse. Across the United States in 2017, 191 million prescriptions for opioids were written by physicians, ultimately leading one in four patients who begins long-term opioid therapy to an addiction.
74.2
opioid prescriptions per 100 Michigan residents, 2017
58.7
opioid prescriptions per 100 U.S. residents, 2017
After peaking in 2012, the U.S. opioid prescribing rate has been on a steady decline for the last several years due to the explosion of the opioid epidemic and the recognition of the role that excessive opioid prescriptions have played in this epidemic. Between 2013 and 2017, the opioid prescribing rate in the United States dropped from 78.1 prescriptions per 100 residents to 58.7 prescriptions per 100 residents, a decrease of 24.84%. The opioid prescribing rate in Michigan was consistently above the U.S. prescribing rate during that time period, from 98.9 prescriptions per 100 residents in 2013 to 74.2 prescriptions per 100 residents in 2017, revealing a similar decrease of 24.97%.
Michigan and U.S. Opioid Prescribing Rates, 2013-2017
The rate of homelessness in Michigan is slightly less than half the national average
A high rate of homelessness in an area indicates a greater potential for substance abuse issues. Homelessness has been shown to be linked to substance abuse as both a cause and a result; some individuals become homeless due to a substance use disorder, while other individuals who are already homeless frequently turn to substance use to dull the pain and desperation of their situation.
The 2018 Department of Housing and Urban Development’s (HUD) Point-in-Time Count reported approximately 552,830 homeless individuals in the United States, the equivalent of 17 of every 10,000 U.S. residents. This number represents a decrease of 4.1% since 2014 when the number of homeless persons in the U.S. was around 576,450. Furthermore, homelessness across the United States has decreased by 15% since 2007, the year that HUD began collecting data on the homeless population.
8
of every 10,000 Michigan residents were homeless, 2018
17
of every 10,000 U.S. residents were homeless, 2018
By comparison, Michigan had approximately 8,351 homeless persons in 2018, equating to 8 of every 10,000 Michigan residents and just slightly less than half the national average. This number reveals a 31.7% decrease since 2014 when 12,227 homeless persons lived in Michigan.
Regional Substance Abuse Statistics & Rehabs
The following sections provide a deeper look at the substance abuse problem in Michigan by examining the drug- and alcohol-related death rates in the five most populous cities. Additionally, the three highest-rated rehabilitation centers in each city are listed.
Detroit
The three highest-rated rehabilitation centers in Detroit are listed in the table below, along with each institution’s performance based on our core metrics.
The Highest-Rated, Low-Cost Rehabs in Detroit
| Detroit Central City Integrated Health | American Indian Health & Family Services of SE Michigan, Inc. | Positive Images, Inc. | |
| Rehabilitation Services Provided | 3 | 1 | 2 |
| Treatment Approaches | 10 | 7.77 | 3.33 |
| Cost | 6.25 | 8.75 | 6.25 |
| Special Programs for Unique Demographics | 9.1 | 1.82 | 6.37 |
| Ancillary Services | 9.12 | 9.5 | 7.6 |
| Total Score | 6.9 | 5.2 | 4.4 |
Drug- and alcohol-induced deaths are much lower in Detroit than across Michigan
13.23%
of Detroit deaths are caused by drugs and alcohol
16.6%
of Michigan deaths are caused by drugs and alcohol
Wayne County, in which Detroit is located, had a higher raw number of deaths due to drugs and alcohol than the counties that encompass Michigan’s other four most populous cities. Despite this fact, it had the lowest percentage of drug-and alcohol-induced deaths at 13.23%, which was also significantly less than the state average of 16.6%. Of the five most populous cities in Michigan, Detroit ranked last for these types of deaths.
Drug- and Alcohol-Induced Deaths in Wayne County, 2008-2017
| 0-17 | 18+ | All Ages | |
| Drug-Induced Deaths | 30 | 24,937 | 24,967 |
| Alcohol-Induced Deaths | 3 | 2,456 | 2,459 |
| Total Deaths | 3,445 | 203,832 | 207,279 |
| Percentage of Drug & Alcohol-Induced Deaths | 0.96% | 13.44% | 13.23% |
Grand Rapids
The three highest-rated rehabilitation centers in Grand Rapids are listed in the table below, along with each institution’s performance based on our core metrics.
The Highest-Rated, Low-Cost Rehabs in Grand Rapids
| Cherry Health Heart of the City Health Center | Wedgwood Christian Services | Bethany Christian Services | |
| Rehabilitation Services Provided | 10 | 3 | 2 |
| Treatment Approaches | 7.77 | 7.77 | 5.55 |
| Cost | 7.5 | 6.25 | 6.25 |
| Special Programs for Unique Demographics | 1.82 | 3.64 | 8.19 |
| Ancillary Services | 8.74 | 6.08 | 2.66 |
| Total Score | 7.6 | 5.2 | 4.7 |
Grand Rapids’ rate of drug- and alcohol-induced deaths is slightly above the average for Michigan
17.1%
of Grand Rapids deaths are caused by drugs and alcohol
16.6%
of Michigan deaths are caused by drugs and alcohol
Grand Rapids is located in Kent County, where there were 9,148 deaths induced by drugs and alcohol between 2008 and 2017, the equivalent of 17.1% of the total deaths in the county. This percentage was marginally above the state average of 16.6% during the same time period, exceeding it by exactly half a percentage point. Of the five most populous cities in Michigan, Grand Rapids had the second-highest drug- and alcohol-induced death rate.
Drug- and Alcohol-Induced Deaths in Kent County, 2008-2017
| 0-17 | 18+ | All Ages | |
| Drug-Induced Deaths | 10 | 7,749 | 7,759 |
| Alcohol-Induced Deaths | 2 | 1,387 | 1,389 |
| Total Deaths | 803 | 52,697 | 53,500 |
| Percentage of Drug & Alcohol-Induced Deaths | 1.49% | 17.34% | 17.1% |
Source: CDC Wonder
Warren-Sterling Heights
The three highest-rated rehabilitation centers in Warren-Sterling Heights and the neighboring cities of Clinton Township and Royal Oak are listed in the table below, along with each institution’s performance based on our core metrics.
The Highest-Rated, Low-Cost Rehabs in the Warren-Sterling Heights Area
| Ascension Eastwood Behavioral Health at Woodward | Ascension Eastwood Behavioral Health at Garfield | Quality Behavioral Health | |
| Rehabilitation Services Provided | 7 | 4 | 4 |
| Treatment Approaches | 5.55 | 5.55 | 3.33 |
| Cost | 7.5 | 7.5 | 3.75 |
| Special Programs for Unique Demographics | 0.91 | 0.91 | 2.73 |
| Ancillary Services | 7.6 | 7.22 | 5.7 |
| Total Score | 5.9 | 4.9 | 3.8 |
Deaths due to drugs and alcohol in Warren-Sterling Heights are similar to the average rate for Michigan
16.91%
of Warren-Sterling Heights deaths are caused by drugs and alcohol
16.6%
of Michigan deaths are caused by drugs and alcohol
Warren and Sterling Heights are located in Macomb County, which experienced 16,665 drug- and alcohol-induced deaths in the period between 2008 and 2017. This equated to 16.91% of total deaths among all ages for the county, which was similar to the average for the state of 16.6% during the same time period. Of Michigan’s five most populous cities, Warren-Sterling Heights’ drug- and alcohol-induced death rate fell in the middle.
Drug- and Alcohol-Induced Deaths in Macomb County, 2008-2017
| 0-17 | 18+ | All Ages | |
| Drug-Induced Deaths | 21 | 14,992 | 15,013 |
| Alcohol-Induced Deaths | 0 | 1,652 | 1,652 |
| Total Deaths | 916 | 97,636 | 98,552 |
| Percentage of Drug & Alcohol-Induced Deaths | 2.29% | 17.05% | 16.91% |
Source: CDC Wonder
Ann Arbor
The three highest-rated rehabilitation centers in Ann Arbor are listed in the table below, along with each institution’s performance on our core metrics.
The Highest-Rated, Low-Cost Rehabs in Ann Arbor
| Dawn Farm Spera Recovery Center | Home of New Vision | Dawn Farm Outpatient Services | |
| Rehabilitation Services Provided | 2 | 6 | 3 |
| Treatment Approaches | 7.77 | 4.44 | 6.66 |
| Cost | 10 | 5 | 3.75 |
| Special Programs for Unique Demographics | 0 | 2.73 | 4.55 |
| Ancillary Services | 7.6 | 6.46 | 4.56 |
| Total Score | 5.3 | 5.0 | 4.5 |
The rate of drug- and alcohol-induced deaths in Ann Arbor is well below the state average
14.74%
of Ann Arbor deaths are caused by drugs and alcohol
16.6%
of Michigan deaths are caused by drugs and alcohol
Washtenaw County, which includes the city of Ann Arbor, reported 3,620 deaths induced by drugs and/or alcohol between 2008 and 2017, representing 14.74% of total deaths among all ages in the county. This percentage was less than the state average of 16.6% during the same time frame by almost two percentage points. Among Michigan’s five most populous cities, Ann Arbor had the fourth-highest death rate.
Drug- and Alcohol-Induced Deaths in Washtenaw County, 2008-2017
| 0-17 | 18+ | All Ages | |
| Drug-Induced Deaths | 4 | 3,078 | 3,082 |
| Alcohol-Induced Deaths | 1 | 537 | 538 |
| Total Deaths | 315 | 24,241 | 24,556 |
| Percentage of Drug & Alcohol-Induced Deaths | 1.59% | 14.91% | 14.74% |
Source: CDC Wonder
Lansing
The three highest-rated rehabilitation centers in Lansing are listed in the table below, along with each institution’s performance on our core metrics.
The Highest-Rated, Low-Cost Rehabs in Lansing
| Child and Family Charities | Mid-Michigan Recovery Services | Professional Psychological & Psychiatric Services, Inc. | |
| Rehabilitation Services Provided | 2 | 2 | 3 |
| Treatment Approaches | 2.22 | 2.22 | 2.22 |
| Cost | 6.25 | 7.5 | 2.5 |
| Special Programs for Unique Demographics | 3.64 | 1.82 | 3.64 |
| Ancillary Services | 2.66 | 2.28 | 2.66 |
| Total Score | 3.2 | 3.2 | 2.8 |
Lansing has a drug and alcohol death rate that is significantly above the state average
18.03%
of Lansing deaths are caused by drugs and alcohol
16.6%
of Michigan deaths are caused by drugs and alcohol
Between 2008 and 2017, there were 4,504 deaths due to drugs and/or alcohol in Ingham County, where the state capital of Lansing is located. This number was the equivalent of 18.03% of total deaths among all ages in the county during that time period, exceeding the state average of 16.6% by nearly one-and-a-half percentage points. Of Michigan’s five most populous cities, Lansing had the highest death rate.
Drug- and Alcohol-Induced Deaths in Ingham County, 2008-2017
| 0-17 | 18+ | All Ages | |
| Drug-Induced Deaths | 3 | 3,890 | 3,893 |
| Alcohol-Induced Deaths | 1 | 610 | 611 |
| Total Deaths | 338 | 24,637 | 24,975 |
| Percentage of Drug & Alcohol-Induced Deaths | 1.18% | 18.27% | 18.03% |
Source: CDC Wonder
Find Rehab in Michigan
Take Action
Substance abuse treatment is available in Michigan for anyone who needs help beating an addiction – you don’t have to struggle alone. To receive assistance, start by determining your insurance coverage and by contacting your referral center. You can also use our tool earlier in this guide to locate a treatment center near you. Remember, many low-cost rehabilitation centers can help if you don’t have insurance coverage or feel like you are unable to afford treatment.