Veterans face unique challenges that can put them at higher risk for substance abuse than the general population. Factors leading to increased risk include things like PTSD and homelessness.
Drug & Alcohol Addiction Rehab, Treatment & Recovery Resources in New York State
TABLE OF CONTENTS
Getting Help
What to Consider When Choosing a Rehab Center
There are many different types of rehab programs and treatment options to consider. Here are a few of the decisions you need to make:
- Service Setting: Will you be considering residential inpatient programs or outpatient programs?
- Specialized Rehabs: Are you interested in holistic rehabs or rehabs for dual diagnosis, or just alcohol and drug detox?
- Rehab Lengths: Are you looking for a shorter rehab length (30 days) or a longer-term option (60, 90, or 120+ days)?
The main factors that determine which rehab options will be best for you are the severity of your addiction and your unique personal and financial situation.
For more information on how to make all of these decisions, read our guide to Choosing the Right Rehab
The Highest Rated, Low-Cost Rehabs in New York State
If the cost of rehab is a barrier for you (as it is for many) and you don’t have insurance, there are still ways for you to get help. Out of the 784 rehab facilities recognized by the Substance Abuse and Mental Health Administration (SAMHSA) in New York, 216 offer some sort of payment assistance to most adults. Out of those 216 rehabs, Council on Addiction Recovery Services, Inc. (CAReS) in Olean (Southwestern New York) received the highest overall scores from Help.org.
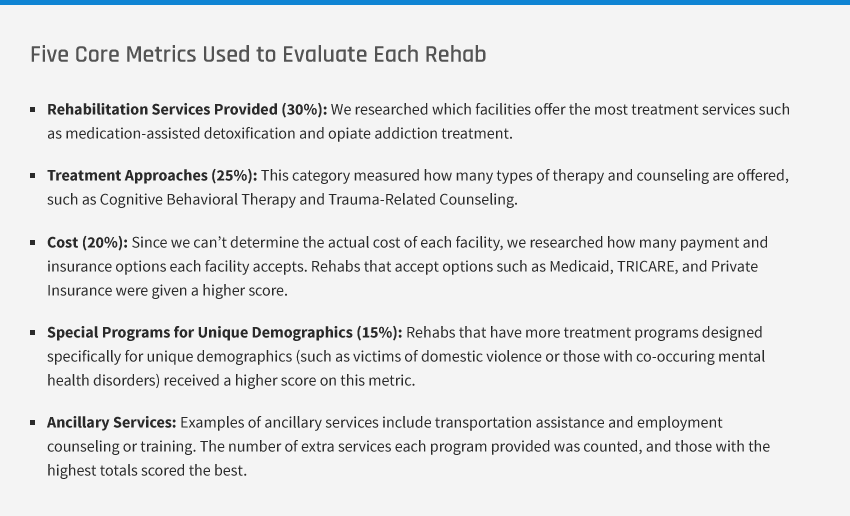
For more information about the five core metrics, head to the full breakdown of our filtering process and ranking methodology
1. Council on Addiction Recovery Services
Council on Addiction Recovery Services, Inc. (CAReS) provides residential inpatient treatment services to the Southwestern portion of New York. The rehab received an overall score of 7.4, and it performed the best on Treatment Approaches – it received the highest possible score since it offers 13 different treatment methods such as Matrix Model and Relapse Prevention. The rehab’s weakest performance came on “Rehabilitation Services Provided – it was given a score of 5.67 since it only offers nine unique rehabilitation services. It notably doesn’t offer disulfiram (Antabuse®) or acamprosate (Campral®). However, it does prescribe and administer buprenorphine and naltrexone.
- Rehabilitation Services Provided: 5.67
- Treatment Approaches: 10
- Cost: 6.66
- Special Programs for Unique Demographics: 7.67
- Ancillary Services: 7.2
2. Odyssey House
Odyssey House’s main offices are located in the Bronx, and it provides integrated behavioral health care in the form of outpatient and inpatient treatment to residents across all five boroughs of New York City. One notable extra service it offers is housing assistance for patients who complete the program. Odyssey House scored a 7.0 overall, and it performed the best on “Treatment Approaches” and “Cost.” It uses 11 different treatment approaches and accepts state insurance plans including Medicaid and Medicare. It performed worst on the core metric that measures the number of different rehabilitation services provided.
- Rehabilitation Services Provided: 5.67
- Treatment Approaches: 8
- Cost: 7.77
- Special Programs for Unique Demographics: 7.08
- Ancillary Services: 6.9
3. Catholic Charities – Monticello Campus
Catholic Charities operates several rehab centers across Orange and Sullivan counties, but the location that scored the best was the Monticello campus near the Catskill Mountains in Southern Upstate New York. It provides inpatient residential treatment at its campus in Monticello. With a 6.71, the facility scored just 0.01 higher than the fourth place contender, START. This rehab scored well above average because of the high number of treatment approaches it uses (11) and the number of extra services (38) it offers. It’s weakest performance was on the core metrics “Cost” and “Rehabilitation Services Provided.” Like the other two rehabs that placed in the top three, it only provided nine unique rehabilitation services, which is only slightly above average. Notably, it doesn’t accept TRICARE (the military health insurance program), but it does accept Medicaid and Medicare, as well as other state health plans.
- Rehabilitation Services Provided: 5.67
- Treatment Approaches: 8
- Cost: 5.55
- Special Programs for Unique Demographics: 7.08
- Ancillary Services: 8.4
Top-Rated, Low-Cost Treatment Centers in New York State
| Rank | Rehab | Total Score | Contact Information |
| #1 | Council on Addiction Recovery Services, Inc | 7.4 | 201 South Union Street Olean, NY 14760 Main Tel: 716-373-4303 |
| #2 | Odyssey House | 7.0 | 953 Southern Boulevard Suite 301Bronx, NY 10459 Main Tel: 718-860-2994 |
| #3 | Catholic Charities – Monticello Campus | 6.7 | 17 Hamilton Avenue 1st and 2nd Floors Monticello, NY 12701 Main Tel: 845-794-8080 x119 |
| #4 | START | 6.7 | 494 Dumont Avenue 1st Floor Brooklyn, NY 11207 Main Tel: 718-385-4000 x1 |
| #5 | The Regional Center of Excellence for Behavioral Health | 6.6 | 462 Grider Street Buffalo, NY 14215 Main Tel: 716-898-3137 |
| #6 | Dick Van Dyke Treatment Center | 6.4 | 1330 County Road 132 Ovid, NY 14521 Main Tel: 607-869-9500 |
| #7 | Catholic Charities – Commack Campus | 6.3 | 155 Indian Head Road Commack, NY 11725 Main Tel: 631-543-6200 |
| #8 | Argus Community Inc. – Elizabeth L Sturz Outpatient Center | 6.1 | 760 East 160th Street Bronx, NY 10456 Main Tel: 718-401-5700 |
| #9 | Strong Recovery | 6.0 | 2613 West Henrietta Road Suite C Rochester, NY 14623 Main Tel: 585-275-3161 |
| #10 | Margaret A. Stutzman Addiction Treatment Center | 6.0 | 360 Forest Avenue Buffalo, NY 14213 Main Tel: 716-882-4900 |
Finding a Substance Abuse Treatment Center in New York State
The New York State Office of Alcoholism and Substance Abuse Services (OASAS) oversees and licenses treatment providers in the state of New York. You can visit the OASAS’ website for an overview of the process of accessing treatment in the state and for answers to common questions.
Below we will detail the three steps for finding treatment and getting help for residents of New York State.
Start by determining your coverage
If you have private insurance or coverage purchased through the healthcare marketplace, contact your plan provider for to determine exactly what services are covered. If you have Medicaid (or to determine whether you qualify), visit health.ny.gov to get started. Whatever type of coverage you have, insurance companies (public and private) are required to cover substance abuse treatment for qualified individuals.
Use our database to find a treatment center near you
The tool below lists all of the treatment centers in the state of New York recognized by the Substance Abuse and Mental Health Services Administration (SAMHSA). Input your zip code and select the filter icon to find relevant rehabs near you.
Schedule an assessment
If you are pursuing treatment that will be covered by insurance, your first step will likely be scheduling an assessment by a qualified individual such as a therapist or counselor. Most facilities provide assessments, or your primary care provider may be able to refer you. Contact companies in our database above to find out if they will provide this service.
Find a Rehabilitation Facility Near You

Filter Your Search
Popular Searches
Type Of Care
Treatment Approaches
Service Setting
Age Groups Accepted
Ancillary Services
Facility Operation
Facility Smoking Policy
Gender Accepted
Language Services
License Certification Accreditation
Payment Assistance Available
Payment Methods and Insurance Accepted
Special Programs Groups Offered
What to Expect in Rehab
If you have private insurance or coverage purchased through the healthcare marketplace, contact your plan provider for to determine exactly what services are covered. If you have Medicaid (or to determine whether you qualify), visit health.ny.gov to get started. Whatever type of coverage you have, insurance companies (public and private) are required to cover substance abuse treatment for qualified individuals.
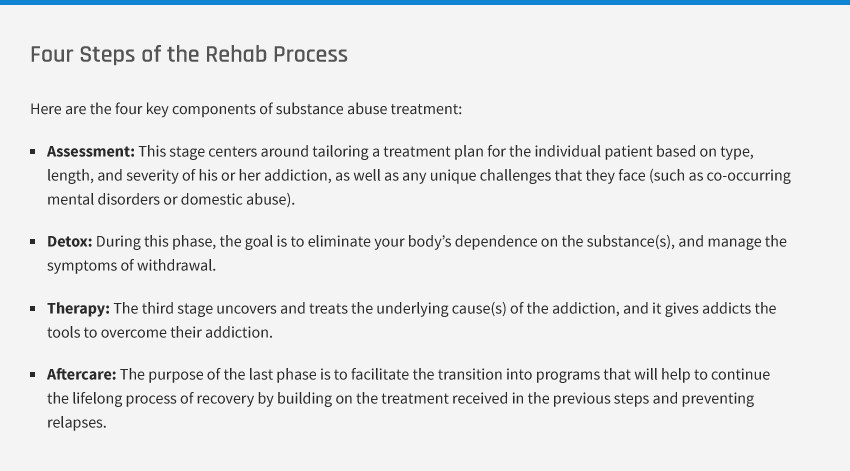
For more information, read our guide to the addiction rehabilitation process
Rehab for At-Risk Groups
Substance Abuse Treatment for Veterans
1 in 15 veterans had a substance use disorder in 2015
1 in 15
Veterans had substance use disorder in 2015
Veterans have access to additional resources for treatment, and VA benefits often cover the cost. To get help with substance abuse from the VA health care system follow these steps:
- Enroll: If you aren’t enrolled already, you can check to see if you are eligible by using the Health Benefits Explorer, and then complete the application.
- Discover: Find out whether your local VA center provides substance use disorder (SUD) treatment by calling or visiting the center. If you don’t know where the closest VA is, call the VA hotline to find out: 1-800-827-1000.
- Find Treatment: If your local VA does provide SUD treatment, then discover what your options are and enroll in treatment. If your local VA doesn’t provide SUD treatment, then use the SUD program locator to find one that does.
You can also use the appropriate filter in our database above to find veteran-specific treatment options, or visit OASAS’ directory of state-licensed programs that offer special programs for veterans struggling with substance abuse.
For more information, read our guide on Substance Abuse Rehab for Veterans
Substance Abuse Treatment for Teens
1 out of 10 youths abused substances in 2013
16%
Binge Drinking
10%
Illicit Drug Usage
In New York, nearly 16% of youth participated in binge drinking in 2013, and 10% used illicit drugs. To overcome the challenges that youth face in overcoming substance addiction, some treatment centers provide teen-specific treatment programs. Our database has a filter that allows you to find the closest rehabs that provide that treatment option.
Additional Resources for Parents and Teachers
Use the following resources to get a better understanding of three of the biggest dangers to youth: prescription drug abuse, underage drinking, and marijuana use.
Co-Occurring Mental Health & Substance Abuse Treatment
Substance abuse and mental health issues tend to go hand-in-hand – the technical term is “co-occurring mental and substance use disorders.” The Substance Abuse and Mental Health Services Administration (SAMHSA) estimates that 18% of those with some form of mental health illness also have a substance use disorder, and 39% of those with a substance use disorder also have a mental health disorder.
Mental Health Resources & Treatment
If you or someone you love is suffering from mental health issues such as depression, PTSD, eating disorders, or severe anxiety there are many resources and ways to get help. Below are a few quick ways to get immediate help, as advised from MentalHealth.gov:
- Emergency Services: If your life (or someone else’s life) is in danger, always start by dialing 911 to get immediate access to emergency services.
- Suicide Prevention: The number for the National Suicide Prevention Lifeline is: 800-273-8255. You can also initiate a private live online chat.
- Veterans Crisis Line: Dial 800-273-8255 to talk to someone immediately. You can also access help with a private online chat, or you can text 838255.
For those who need mental health help but don’t have an immediate need, the New York Office of Mental Health (OMH) has a website that provides education as well as state-specific treatment options, and a special mental health program for veterans. Those who have mental health issues and a substance abuse problem may benefit from dual-diagnosis rehabs. Use the appropriate filter in our tool above to find rehab centers with programs designed to meet the unique challenge posed by co-occurring disorders.
Finding Aftercare in New York State
Aftercare is often overlooked, but it’s one of the most crucial steps in the rehabilitation process. The chances of relapsing after rehab dramatically rise for individuals who just try and go back to “normal life,” rather than pursuing further treatment in aftercare. There are several types of aftercare including follow-up visits for continued therapy, group therapy, and sober living homes.
12-Step Addiction Meetings in New York State
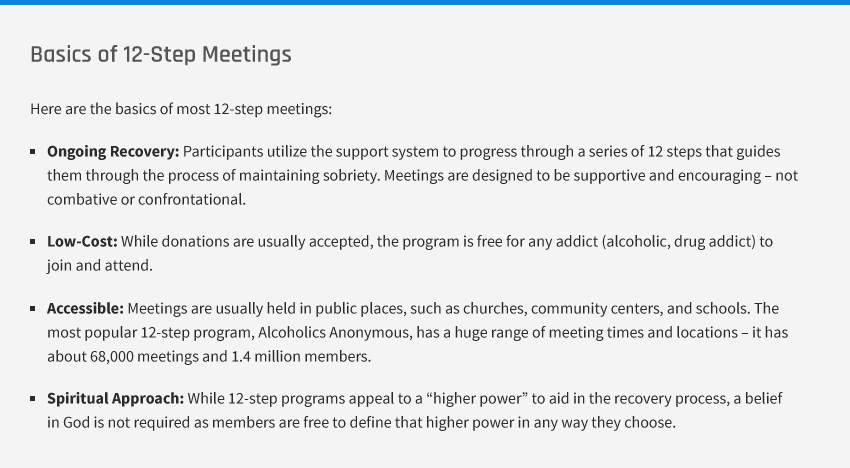
Alcoholics Anonymous (AA) designed the 12-step process for those recovering from an alcohol addiction, and today there are many other 12-step programs for other addictions and issues – Narcotics Anonymous (NA) is one only one example.
Contact the appropriate local organization to find an AA or NA meeting near you
The tool below lists the contact information for local organizations that will connect you to Alcoholics Anonymous (AA) or Narcotics Anonymous (NA) meetings near you. Since meeting times and locations change periodically, contact the local groups that coordinate the meetings to ensure that the information is up to date.
Alcoholics Anonymous (AA) and Narcotics Anonymous (NA) Database
| Name | City | Program | Telephone | Spanish Hotline |
|---|
Sober Living Homes
Sober living homes (also referred to as recovery residences) are group homes that help recovering addicts transition from treatment facilities to living on their own, while maintaining sobriety. They are especially helpful for those who don’t have a supportive and positive environment to live in after rehab.
Residents can stay for a couple months of for years, as long as they follow the rules and don’t relapse (most homes have a zero tolerance policy for using substances). Other rules usually include completing chores, attending mutual support groups regularly, and paying an equal share of the cost of renting the home.
Some halfway houses are listed in our database, and you can find them by using the appropriate filter in our tool above. Otherwise, head to our guide on sober living homes to learn more about sober living homes, and to find a certified recovery residence near you.
Substance Abuse in New York State
Overview
The percentage of heroin users in New York is double that of the rest of the nation
0.44%
of New York residents use heroin
0.27%
of Americans use heroin
While the percentage of heroin users to the rest of the population is low, it’s considerably higher than the national percentage (0.44% vs. 0.27%). New Yorkers also use Marijuana and Cocaine at a higher rate than the rest of the nation (the national percentages of those who use cocaine and those who use marijuana are 1.46% and 11.09%, respectively).
Annual Averages for Substance Abuse in New York State
| Ages: 12-17 | Ages: 18+ | Total | New York % of Population | National % of Population | |
| Alcohol (AUD)* | 1,038,000 | 36,000 | 1,073,000 | 5.43% | 5.10% |
| Cocaine | 10,000 | 414,000 | 425,000 | 2.15% | 1.46% |
| Heroin | 2,000 | 86,000 | 87,000 | 0.44% | 0.27% |
| Marijuana | 188,000 | 2,331,000 | 2,519,000 | 12.75% | 11.09% |
* AUD stands for Alcohol Use Disorder. The numbers reflected on the table above are not the number of individuals who use alcohol, but rather those who have an AUD.
The rate of drug and alcohol induced deaths in New York is slightly higher than the rest of the nation
14%
of New York deaths are caused by drugs and alcohol
13%
of US deaths are caused by drugs and alcohol
The table below shows the number of deaths caused (or partially caused) by drugs and alcohol in the 10-year span between 2006 and 2015. The rate of deaths in every age group is within one percentage point of the national average.
Deaths Caused by Drugs and Alcohol in New York State Between 2006 and 2015
| Ages: 12-17 | Ages: 18+ | All Ages | |
| Drug-Induced Deaths | 121 | 181,903 | 182,078 |
| Alcohol-Induced Deaths | 13 | 25,551 | 25,580 |
| Total Deaths | 3,143 | 1,467,471 | 1,487,024 |
| Percentage of Drug & Alcohol-Induced Deaths | 4.26% | 14.14% | 13.96% |
Amphetamines were rarely the main reason people went to rehab in 2015
0.7%
of New York rehab admissions are for meth
9%
of US rehab admissions are for meth
Only 0.7% of addicts who went to state-funded rehab facilities in 2015 listed amphetamines (including meth) as their primary substance of abuse, while about 9% of rehab admissions were related to amphetamines nationally. On the other hand, heroin was treated at a high rate compared to the rest of the nation – nearly one-third of all those admitted into rehabs listed heroin as their primary addiction.
Admission into State-Funded Treatment Programs in 2015
| Total Admissions in New York | Percent of all Admissions in New York | Percent of All Admissions in the US | |
| All Substances | 281,000 | 100% | 100% |
| Alcohol (Including alcohol usage with secondary drug) | 107,293 | 38.1% | 33.9% |
| Heroin | 86,140 | 30.6% | 25.4% |
| Marijuana | 39,240 | 13.9% | 14.1% |
| Cocaine (Including smoked and other usage) | 21,429 | 7.6% | 5.0% |
| Other Opiates (Including prescription painkillers) | 17,505 | 6.2% | 8.2% |
| Tranquilizers | 4,045 | 1.4% | 0.9% |
| Amphetamines (Including methamphetamines) | 1,905 | 0.7% | 8.9% |
| Other/Unknown | 1,730 | 0.6% | 3.0% |
| Sedatives | 1,075 | 0.4% | 0.2% |
| PCP | 964 | 0.3% | 0.3% |
| Hallucinogens | 213 | 0.1% | 0.1% |
| Other Stimulants | 90 | 0.0% | 0.1% |
| Inhalants | 71 | 0.0% | 0.0% |
Key Indicators of Substance Abuse Issues
When trying to understand the substance abuse problem in a specific area, researchers and policymakers examine “key indicators.” Combined with usage stats, key indicators can provide a deep level of insight into which substances and demographics present the biggest problem and are at the highest risk. Key indicators with recent, credible statistics available are examined below.
17% of New Yorkers struggle with mental health issues
Based on data from The Substance Abuse and Mental Health Services Administration (SAMHSA), 18% of those with some form of mental health illness also have a substance use disorder, and 41% of those with a substance use disorder also have a mental health disorder. The combination of the two issues is called a “dual diagnosis“. Because of the link between the problems, the prevalence of mental health problems helps us to understand substance abuse in New York.
17%
of New Yorkers have mental health problems
13.5%
of Americans have mental health problems
As you can see in the table below, mental health problems afflict more than one out of every six New Yorkers (or 17.22%), which is considerably higher than the national average of 13.55%.
New York Annual Averages for Mental Health Issues in 2014 and 2015
| Ages: 12-17 | Percentage of Population | Ages: 18+ | Percentage of Population | |
| Major Depressive Episode | 170,000 | 11.92% | 999,000 | 6.52% |
| Serious Mental Illness | No Data | No Data | 598,000 | 3.90% |
| Any Mental Illness | No Data | No Data | 2,638,000 | 17.22% |
| Had Serious Thoughts of Suicide | No Data | No Data | 591,000 | 3.85% |
Suicide is an act that’s often linked with substance abuse; those who have a Substance Use Disorder (SUD) are six times more likely to attempt suicide during their lifetime than those without an SUD. New York had the third lowest suicide rate between 2006 and 2015, and the second lowest for those between the ages of 12 to 17.
Suicides in New York Between 2006 and 2015
| Suicides in New York | Suicides Rank | New York Suicide Rate (Per 100k People) | Suicide Rate Rank | U.S. Suicide Rate (Per 100k People) | |
| Ages: 12-17 | 385 | 7th | 2.5 | 50th | 4.2 |
| Ages: 18+ | 15,137 | 5th | 10.0 | 49th | 16 |
| Total | 15,542 | 5th | 8.0 | 49th | 12.5 |
The rate of DUI-related deaths in New York is about half the national average
The most tangible impact substance abuse has on a community may be when individuals choose to get behind the wheel of a car after using drugs or alcohol. Statistics involving arrests and crashes due to drugs and alcohol give direct insight into the substance abuse problem in the state.
1.4%
of New York drivers drive after drinking too much
1.9%
of US drivers drive after drinking too much
According to the Centers for Disease Control and Prevention (CDC), 1.4% of New York drivers report driving after drinking too much, which is lower than the national average of 1.9%. As you can see in the table below, that results in fewer deaths involving intoxicated drivers.
Deaths Involving Drivers Under the Influence of Alcohol in 2012
| Ages: 0-20 | Ages: 21-34 | Ages: 35+ | All Ages | |
| New York Rate of Deaths (per 100,000) | 0.6 | 3.3 | 1.7 | 1.7 |
| US Rate of Deaths (per 100,000) | 1.3 | 6.7 | 3.1 | 3.3 |
The table below represents the most recent data available regarding DUI trends in New York. In the five-year span between 2012 and 2016, the overall number of crashes due to impaired drivers trended downward. Notably, the crashes involving alcohol decreased significantly, but crashes involving drugs increased. 4.13% of all impaired crashes were fatal in 2016, and another 11.78% resulted in serious injury.
New York DUI Statistics from 2012 to 2016
| 2012 | 2013 | 2014 | 2015 | 2016 | |
| Total Impaired Crashes | 9,555 | 9,243 | 8,726 | 8,579 | 9,208 |
| Alcohol-Related Crashes | 8,633 | 8,368 | 7,849 | 7,464 | 8,056 |
| Drug-Related Crashes | 1,339 | 1,261 | 1,239 | 1,534 | 1,611 |
Physicians in New York prescribe opioid painkillers at a comparatively low rate
Prescription drug abuse (particularly opioid painkillers and Benzodiazepines) is an increasing problem in the United States. While it is difficult to estimate how many people use these drugs as prescribed and how many abuse them, the CDC and IMS have researched the variation in painkiller prescriptions between states. The more prescriptions are written, the greater the potential for dependence and abuse.
59.5
opioid pain reliever prescriptions per 100 people in New York State
87
opioid pain reliever prescriptions per 100 people in the US
New York ranks near the bottom for the rate of prescriptions written in 2012 in every category but one – the prescription rate for high-dose opioid pain relievers in New York was about average at 4.3 per 100 people.
Painkiller Prescriptions in New York per 100 People in 2012
| New York | National Average | State Rank | |
| Opioid Pain Relievers | 59.5 | 87.3 | 49th |
| Long-Acting/Extended-Release Opioid Pain Relievers | 9.5 | 12.0 | 39th |
| High-Dose Opioid Pain Relievers | 4.3 | 4.5 | 24th |
| Benzodiazepines | 27.3 | 39.2 | 45th |
There’s a high proportion of homeless people in New York compared to the U.S.
A high rate of homelessness in an area indicates a greater potential for substance abuse problems. Homelessness has been shown to be linked to substance abuse as both the cause and result.
In New York, the rate of homelessness is very high, and it’s been trending upward since 2013. 16% of all homeless people live in New York, but only 4% were living on the street (as opposed to homeless shelters).
Substance Abuse Among At-Risk Groups
“At-Risk Groups” are segments of the population who are especially vulnerable to developing a substance abuse problem, or those who have a higher likelihood of negative outcomes. While there are several different demographics that fit into this category (such as pregnant women and veterans), the only recent statistics in the state of New York have to do with youth. Youth are considered “at-risk” because the effect of substance-abuse on their still-developing brain is more extreme than with older addicts.
New York youths binge drink alcohol at a slightly higher rate than teens in the U.S.
16%
of New York youth had a binge drinking session in 2013
15%
of US youth had a binge drinking session in 2013
While 12 to 17 year-olds in New York use drugs at about the same rate as the rest of the nation’s youth, the percentage of youths who participate in binge drinking is slightly higher. However, binge drinking declined significantly between 2009 and 2013.
Substance Abuse Among Youth
| Illicit Drug Use in New York | Illicit Drug Use in the U.S. | Binge Alcohol Use in New York | Binge Alcohol Use in the U.S. | |
| 2009 – 2010 | 10.9% | 10.1% | 19.2% | 17.5% |
| 2010 – 2011 | 10.2% | 10.1% | 18.3% | 16.3% |
| 2011 – 2012 | 9.4% | 9.8% | 17.7% | 15.6% |
| 2012 – 2013 | 9.6% | 9.2% | 15.8% | 14.7% |
SAMHSA’s Behavioral Health Barometer – New York, 2014
Regional Substance Abuse Statistics & Rehabs
The following sections provide a deeper look at the substance abuse problem in New York by examining key indicators in the five largest cities. Additionally, the three highest-rated rehabs that offer some type of payment assistance near each city are listed.
New York City
The three highest rated rehabs in the New York City area that offer payment assistance are listed in the table below, along with each institution’s performance on our core metrics.
The Highest-Rated, Low-Cost Rehabs Near New York City
| Odyssey House | START | Catholic Charities – Commack Campus | |
| Rehabilitation Services Provided | 5.67 | 8.82 | 5.04 |
| Treatment Approaches | 8 | 8 | 8 |
| Cost | 7.77 | 6.66 | 6.66 |
| Special Programs for Unique Demographics | 7.08 | 1.18 | 5.31 |
| Ancillary Services | 6.9 | 5.4 | 6.9 |
| Total Score | 7.0 | 6.7 | 6.3 |
Deaths from drugs and alcohol in New York City occur at a relatively low rate
8%
of New York City deaths are caused by drugs and alcohol
14%
of New York State deaths are caused by drugs and alcohol
The percentage of deaths due to drugs and alcohol between 2006 and 2015 in Brooklyn was considerably lower than both the state average (13.96%) and the national average (13.36%).
Drug and Alcohol-Induced Deaths in Kings County Between 2006 and 2015
| Ages: 12-17 | Ages: 18+ | All Ages | |
| Drug-Induced Deaths | 10 | 10,124 | 10,136 |
| Alcohol-Induced Deaths | N/A | 3,324 | 3,324 |
| Total Deaths | 405 | 170,265 | 173,176 |
| Percentage of Drug & Alcohol-Induced Deaths | 2.47% | 7.90% | 7.77% |
Homelessness in New York City is on the rise
Between 2012 and 2016, the number of homeless people rose by nearly 17,000 people, which is an increase of 30%. However, the number of homeless veterans sharply decreased by about 3,000 people or 85%.
Homelessness in New York City Between 2012 and 2016
| 2012 | 2013 | 2014 | 2015 | 2016 | |
| Sheltered Homeless | 53,410 | 60,880 | 64,453 | 72,140 | 70,685 |
| Unsheltered Homeless | 3,262 | 3,180 | 3,357 | 3,183 | 2,838 |
| Homeless Veterans | 3,790 | 3,547 | 1,645 | 1,558 | 559 |
| Total Homeless | 56,672 | 64,060 | 67,810 | 75,323 | 73,523 |
The rate of tickets written for impaired driving is well below the state average
1.6
impairment tickets written per 10,000 people in New York City in 2016
4.7
impairment tickets written per 10,000 people in New York State in 2016
Possibly due to the fact that many residents of New York City don’t drive on a regular basis, the rate of DUI tickets written per 10,000 population is much lower than the rest of the state. It’s also been about the same since 2012, with a slight decrease in 2015.
Impairment Tickets Written Per 10,000 Population
| 2012 | 2013 | 2014 | 2015 | 2016 | |
| Albany County | 8.1 | 7.9 | 7.7 | 8.6 | 8.7 |
| Erie County | 6.6 | 6.8 | 6.4 | 6.5 | 6.6 |
| Kings County | 1.6 | 1.6 | 1.5 | 1.3 | 1.6 |
| Monroe County | 7.2 | 7.5 | 6.9 | 6.6 | 6.9 |
| Onondaga County | 7.6 | 7.2 | 7.4 | 6.7 | 7.1 |
| Statewide | 4.9 | 4.7 | 4.4 | 4.3 | 4.7 |
Buffalo
The three highest rated rehabs near Buffalo that offer payment assistance are listed in the table below, along with each institution’s performance on our core metrics.
The Highest-Rated, Low-Cost Rehabs Near Buffalo
| The Regional Center of Excellence for Behavioral Health | Margaret A. Stutzman Addiction Treatment Center | Horizon Health Services | |
| Rehabilitation Services Provided | 6.93 | 6.3 | 6.3 |
| Treatment Approaches | 9 | 6 | 9 |
| Cost | 5.55 | 6.66 | 5.55 |
| Special Programs for Unique Demographics | 2.36 | 4.13 | 1.77 |
| Ancillary Services | 8.4 | 6.6 | 4.5 |
| Total Score | 6.6 | 6.0 | 6.0 |
The rate of deaths due to drugs and alcohol in Buffalo is high
15%
of Buffalo deaths are caused by drugs and alcohol
14%
of New York State deaths are caused by drugs and alcohol
Compared to the state average of 13.96%, Buffalo’s rate of alcohol and drug-induced deaths is higher than average.
Drug and Alcohol-Induced Deaths in Erie County Between 2006 and 2015
| Ages: 12-17 | Ages: 18+ | All Ages | |
| Drug-Induced Deaths | N/A | 15,527 | 15,537 |
| Alcohol-Induced Deaths | N/A | 1,328 | 1,328 |
| Total Deaths | 191 | 110,832 | 112,015 |
| Percentage of Drug & Alcohol-Induced Deaths | 5.24% | 15.21% | 15.06% |
Homelessness has been declining in Buffalo
On a single day in 2016, there were over 200 fewer homeless people then there were on the same day in 2012. Additionally, less than 6% of the homeless population lacked shelter.
Homelessness in Buffalo
| 2012 | 2013 | 2014 | 2015 | 2016 | |
| Sheltered Homeless | 1,067 | 1,048 | 1,021 | 858 | 905 |
| Unsheltered Homeless | 116 | 114 | 67 | 61 | 57 |
| Homeless Veterans | 67 | 109 | 108 | 88 | 97 |
| Total Homeless | 1,183 | 1,162 | 1,088 | 919 | 962 |
6.6
impairment tickets written per 10,000 people in Buffalo in 2016
4.4
impairment tickets written per 10,000 people in New York State in 2016
Compared to every other city we researched besides New York City, residents of Buffalo were ticketed at a lower rate for the five-year span between 2012 and 2016. The rate slightly fluctuated, but overall it hasn’t changed since 2012.
Impairment Tickets Written Per 10,000 Population
| 2012 | 2013 | 2014 | 2015 | 2016 | |
| Albany County | 8.1 | 7.9 | 7.7 | 8.6 | 8.7 |
| Erie County | 6.6 | 6.8 | 6.4 | 6.5 | 6.6 |
| Kings County | 1.6 | 1.6 | 1.5 | 1.3 | 1.6 |
| Monroe County | 7.2 | 7.5 | 6.9 | 6.6 | 6.9 |
| Onondaga County | 7.6 | 7.2 | 7.4 | 6.7 | 7.1 |
| Statewide | 4.9 | 4.7 | 4.4 | 4.3 | 4.7 |
Rochester
The table below shows the three highest rated treatment centers that offer payment assistance in or near Rochester, along with each institution’s performance on our core metrics.
The Highest-Rated, Low-Cost Rehabs Near Rochester
| Strong Recovery | Rochester Regional Chemical Dependency | Westfall Associates | |
| Rehabilitation Services Provided | 6.3 | 6.3 | 3.78 |
| Treatment Approaches | 6 | 8 | 7 |
| Cost | 7.77 | 5.55 | 4.44 |
| Special Programs for Unique Demographics | 3.54 | 1.18 | 8.26 |
| Ancillary Services | 5.7 | 7.8 | 8.4 |
| Total Score | 6.0 | 6.0 | 5.9 |
The percentage of deaths caused by drugs and alcohol in Rochester is about average
13.8%
of Rochester deaths are caused by drugs and alcohol
14%
of New York State deaths are caused by drugs and alcohol
The percentage of deaths that are caused by drugs and alcohol in Rochester is 13.84%, similar to the national average (13.36%) and the state average (13.96%).
Drug and Alcohol-Induced Deaths in Monroe County Between 2006 and 2015
| Ages: 12-17 | Ages: 18+ | All Ages | |
| Drug-Induced Deaths | N/A | 9,364 | 9,372 |
| Alcohol-Induced Deaths | N/A | 824 | 824 |
| Total Deaths | 136 | 72,728 | 73,661 |
| Percentage of Drug & Alcohol-Induced Deaths | 5.88% | 14.01% | 13.84% |
Homelessness in Rochester is becoming more of a problem
While the number of homeless people fluctuated by a large amount between 2012 and 2016, it was higher in 2016 than in any other year except the large spike in 2013.
Homelessness in Rochester
| 2012 | 2013 | 2014 | 2015 | 2016 | |
| Sheltered Homeless | 699 | 883 | 787 | 727 | 791 |
| Unsheltered Homeless | 0 | 124 | 51 | 35 | 69 |
| Homeless Veterans | 53 | 48 | 51 | 51 | 66 |
| Total Homeless | 699 | 1,007 | 838 | 762 | 860 |
The number of tickets written for impaired driving in Rochester has declined slightly
6.9
impairment tickets written per 10,000 people in Rochester in 2016
4.7
impairment tickets written per 10,000 people in New York State in 2016
The rate of tickets given for impaired driving in Monroe county per 10,000 population is on par with the other cities we measured in Upstate New York, and it declined slightly between 2012 and 2016.
Impairment Tickets Written Per 10,000 Population
| 2012 | 2013 | 2014 | 2015 | 2016 | |
| Albany County | 8.1 | 7.9 | 7.7 | 8.6 | 8.7 |
| Erie County | 6.6 | 6.8 | 6.4 | 6.5 | 6.6 |
| Kings County | 1.6 | 1.6 | 1.5 | 1.3 | 1.6 |
| Monroe County | 7.2 | 7.5 | 6.9 | 6.6 | 6.9 |
| Onondaga County | 7.6 | 7.2 | 7.4 | 6.7 | 7.1 |
| Statewide | 4.9 | 4.7 | 4.4 | 4.3 | 4.7 |
Albany
The three highest rated treatment centers in or near Albany that offer payment assistance are listed below, along with each institution’s performance on our core metrics.
The Highest-Rated, Low-Cost Rehabs Near Albany
| Liberty Behavioral Management | Hope House Inc. | The Addictions Care Center of Albany | |
| Rehabilitation Services Provided | 6.93 | 5.04 | 5.67 |
| Treatment Approaches | 9 | 8 | 6 |
| Cost | 4.44 | 5.55 | 3.33 |
| Special Programs for Unique Demographics | 0.59 | 2.36 | 2.95 |
| Ancillary Services | 3.3 | 4.5 | 4.8 |
| Total Score | 5.6 | 5.4 | 4.8 |
Albany’s drug and alcohol-induced death rate is lower than average
12%
of Albany deaths are caused by drugs and alcohol
14%
of New York State deaths are caused by drugs and alcohol
The percentage of deaths caused by drugs or alcohol is lower than both the state and national average (13.96% and 13.36%, respectively). It’s the second-lowest percentage among the counties we researched in the state, with the exception of Kings County (Brooklyn).
Drug and Alcohol-Induced Deaths in Albany County Between 2006 and 2015
| Ages: 12-17 | Ages: 18+ | All Ages | |
| Drug-Induced Deaths | N/A | 3,272 | 3,274 |
| Alcohol-Induced Deaths | N/A | 360 | 362 |
| Total Deaths | 42 | 29,807 | 30,178 |
| Percentage of Drug & Alcohol-Induced Deaths | 9.52% | 12.19% | 12.05% |
Homelessness has been increasing in Albany
While there has been some fluctuation in the number of homeless people since 2012, the 2016 coun revealed the highest numbers in the last five years. Thankfully, the number of homeless veterans (a group with an increased risk of substance abuse) has declined during the same time period.
Homelessness in Albany
| 2012 | 2013 | 2014 | 2015 | 2016 | |
| Sheltered Homeless | 562 | 709 | 621 | 577 | 722 |
| Unsheltered Homeless | 28 | 19 | 29 | 20 | 26 |
| Homeless Veterans | 112 | 89 | 48 | 75 | 71 |
| Total Homeless | 590 | 728 | 650 | 597 | 748 |
Residents of Albany County were ticketed for impaired driving at the highest rate in the state
8.7
impairment tickets written per 10,000 people in Albany in 2016
4.7
impairment tickets written per 10,000 people in New York State in 2016
Among the five counties and the state, Albany County had the highest number of tickets written for impaired driving per capita. After dipping slightly in 2013 and 2014, the number of tickets for driving under the influence increased in 2015 and 2016.
Impairment Tickets Written Per 10,000 Population
| 2012 | 2013 | 2014 | 2015 | 2016 | |
| Albany County | 8.1 | 7.9 | 7.7 | 8.6 | 8.7 |
| Erie County | 6.6 | 6.8 | 6.4 | 6.5 | 6.6 |
| Kings County | 1.6 | 1.6 | 1.5 | 1.3 | 1.6 |
| Monroe County | 7.2 | 7.5 | 6.9 | 6.6 | 6.9 |
| Onondaga County | 7.6 | 7.2 | 7.4 | 6.7 | 7.1 |
| Statewide | 4.9 | 4.7 | 4.4 | 4.3 | 4.7 |
Syracuse
The three highest rated rehabs in the Syracuse area that offer payment assistance are listed below, along with each institution’s performance on our core metrics.
The Highest-Rated, Low-Cost Rehabs Near Syracuse
| Crouse Health – Chemical Dependency Treatment Services | Syracuse Community Health Center – Behavioral Health Services | CHAD Counseling Inc. | |
| Rehabilitation Services Provided | 4.41 | 5.04 | 6.93 |
| Treatment Approaches | 7 | 7 | 6 |
| Cost | 6.66 | 5.55 | 5.55 |
| Special Programs for Unique Demographics | 4.72 | 0.59 | 2.95 |
| Ancillary Services | 6 | 6.3 | 3.9 |
| Total Score | 5.7 | 5.1 | 5.5 |
Syracuse has a high percentage of deaths caused by drugs and alcohol
16%
of Syracuse deaths are caused by drugs and alcohol
14%
of New York State deaths are caused by drugs and alcohol
Out of the five largest cities in New York, Syracuse had the highest percentage of deaths caused by drugs and alcohol, and the percentage was considerably higher than both the state average (13.96%) and the national average (13.36%).
Drug and Alcohol-Induced Deaths in Onondaga County Between 2006 and 2015
| Ages: 12-17 | Ages: 18+ | All Ages | |
| Drug-Induced Deaths | N/A | 6,984 | 6,989 |
| Alcohol-Induced Deaths | N/A | 742 | 743 |
| Total Deaths | 90 | 48,079 | 48,629 |
| Percentage of Drug & Alcohol-Induced Deaths | 6.67% | 16.07% | 15.90% |
Homelessness in Syracuse spiked in 2014, but it has recently been decreasing
The overall number of homeless people in Syracuse has slightly decreased since 2012, but there was a considerable spike in 2014 when there were over 1,000 people without a home.
Homelessness in Syracuse
| 2012 | 2013 | 2014 | 2015 | 2016 | |
| Sheltered Homeless | 866 | 941 | 1,008 | 906 | 840 |
| Unsheltered Homeless | 16 | 53 | 16 | 16 | 27 |
| Homeless Veterans | 69 | 74 | 67 | 48 | 56 |
| Total Homeless | 882 | 994 | 1,024 | 922 | 867 |
Residents of Syracuse are ticketed for impaired driving at a high rate in Syracuse
7.1
impairment tickets written per 10,000 people in Syracuse in 2016
4.7
impairment tickets written per 10,000 people in New York State in 2016
While both the overall number of tickets given out and the rate per 10,000 people has gone down in the five years between 2012 and 2016, the rate is still the second highest we measured in the state.
Impairment Tickets Per 10,000 Population
| 2012 | 2013 | 2014 | 2015 | 2016 | |
| Albany County | 8.1 | 7.9 | 7.7 | 8.6 | 8.7 |
| Erie County | 6.6 | 6.8 | 6.4 | 6.5 | 6.6 |
| Kings County | 1.6 | 1.6 | 1.5 | 1.3 | 1.6 |
| Monroe County | 7.2 | 7.5 | 6.9 | 6.6 | 6.9 |
| Onondaga County | 7.6 | 7.2 | 7.4 | 6.7 | 7.1 |
| Statewide | 4.9 | 4.7 | 4.4 | 4.3 | 4.7 |
Find Rehab in New York State
Take Action
Substance abuse treatment is available for anyone who needs help in New York – you don’t have to struggle alone. To get help, determine your insurance coverage, then use our tool to find and contact a rehab center near you to schedule an assessment. Remember, many low-cost rehab centers can help if you don’t have insurance coverage or feel that rehab is out of the question due to financial constraints.