Between 2008 and 2017, there were 13,273 deaths induced by drugs and/or alcohol in Hennepin County. This represents 14.08% of the total number of deaths among all ages during the same time period in the county. Additionally, this percentage is 1.37% higher than the percentage of deaths attributed to drugs and alcohol in the United States in the same time frame.
Alcohol, Drug, and other Rehab Centers in Minneapolis, MN
TABLE OF CONTENTS
Getting Help
What to Consider When Choosing a Rehab Center
When thinking about the various treatment options and rehab programs you can explore, important questions to consider asking include:
- Which service setting is best for me? Read the following guides to understand residential inpatient programs and outpatient programs.
- Which specialized rehab programs do I need? Read about the differences between holistic rehabs, rehabs for dual diagnosis, and programs only for alcohol and drug detox.
- How long should I stay? Consider the differences between a shorter rehab length (30days) or a longer-term option (60, 90, or 120+ days).
There are various factors which can impact your options for rehabilitation, ranging from the severity of your addiction to your financial position to your unique personal situation.
For more information on how to make all of these decisions, read our guide toChoosing the Right Rehab.
The Best Rehabs in Minneapolis, MN
The cost of rehab can be high, depending on your needs and location. Whether or not you have insurance, there are ways for you to get help breaking free of your addiction. According to the Substance Abuse and Mental Health Administration (SAMHSA), there are 162 substance abuse treatment centers in the Minneapolis area. Many of these organizations make it their mission to provide substance abuse recovery services to residents, regardless of their financial status. Out of these 162 rehabs, the Buffalo location of the Central Minnesota Health Center has received the highest overall scores based on our five core metrics.
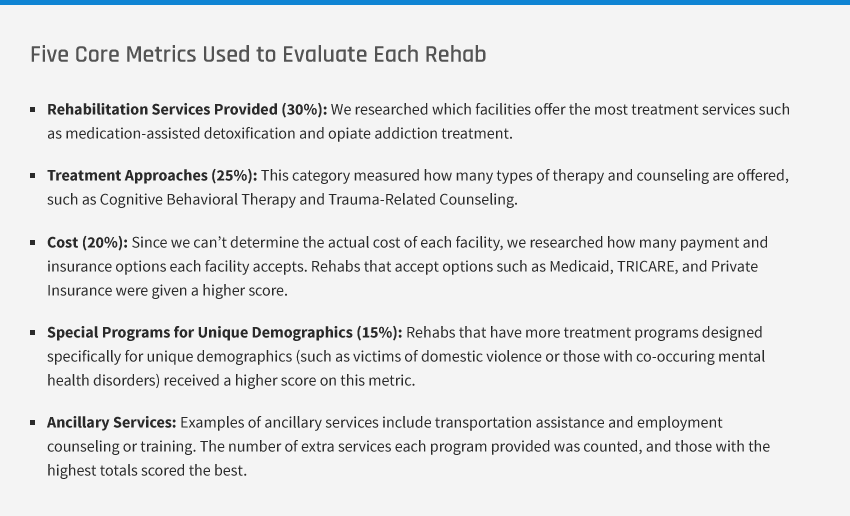
We use five core metrics to evaluate the quality of each facility. For more information, feel free to read a full breakdown of our filtering process and ranking methodology.
1. Central Minnesota Mental Health Center - Buffalo
With an overall score of 6.8 points out of 10 possible points, the Central Minnesota Mental Health Center in Buffalo provides outpatient substance abuse treatment services and does accept clients on opioid medication. It received the highest score for treatment approaches among all facilities that we’ve researched in the area due to its wide variety of options, including cognitive/behavioral therapy, trauma-related counseling, motivational interviewing, relapse management, implementation of both 12-step facilitation and the Matrix Model, and much more.
The facility also scored highly for the 32 ancillary services it provides, such as health education and community outreach programs, employment counseling and training, domestic violence services, treatment for gambling and internet use disorders, and counseling for individuals, couples, and families. Additionally, it provides special programs for populations ranging from adolescents and persons who have been impacted by trauma to persons suffering from co-occurring substance abuse and mental health disorders.
Scoring 5.01 points for cost, the facility accepts multiple forms of payment, such as government-funded programs like Medicaid, private or state-funded health insurance, and self-payment. An income-based sliding fee scale can assist those clients who do not have access to any government or private health benefits.
- Rehabilitation Services Provided: 6.66
- Treatment Approaches: 10.0
- Cost: 5.01
- Special Programs for Unique Demographics: 5.33
- Ancillary Services: 8.3
2. Central Minnesota Mental Health Center - Monticello
The Monticello location of the Central Minnesota Mental Health Center scored 5.2 points out of 10 points overall, and, like its partner location in Buffalo, offers outpatient substance abuse treatment, in addition to accepting clients on opioid medication. Treatment approaches range from trauma-related counseling and brief intervention to motivational interviewing/incentives to relapse prevention. The center also employs the 12-step facilitation approach.
The center scored the highest of all facilities we profiled for its wide variety of ancillary services. With 34 ancillary services from which to choose, clients can look to the center for educational training, health education and community outreach programs, tobacco cessation counseling, housing assistance, self-help or peer support groups, and counseling for individuals, couples, and families. Conversely, the center was lacking in the availability of special programs offered to unique populations.
Similar to other facilities we evaluated in the area, the center scored a 5.01 for cost. It accepts several types of payment options, including government-funded programs, such as Medicaid, private or state-funded health insurance, and self-payment. A sliding fee scale dependent on various factors, including income, is available for those clients who do not have access to government or private health benefits.
- Rehabilitation Services Provided: 6.66
- Treatment Approaches: 4.29
- Cost: 5.01
- Special Programs for Unique Demographics: 1.11
- Ancillary Services: 10.0
3. My Home, Inc.
Scoring 3.5 out of 10 points overall, My Home, Inc. scored the highest among all facilities we’ve researched for its special programs targeted to unique demographics, with an emphasis on African American men, persons with co-occurring substance abuse and mental health disorders, persons who have experienced trauma – especially in the form of intimate partner or domestic violence, clients referred from the court system, and older adults. Additionally, with 18 ancillary services, including community outreach programs, HIV/AIDS and hepatitis education and counseling, housing assistance, domestic violence services, and counseling for individuals, couples, and families, the center’s programs and services are designed for patient success after leaving the facility.
My Home, Inc. offers traditional outpatient substance abuse treatment services and accepts clients on opioid medication. Its treatment approaches are somewhat more limited than other facilities in the area, but do include cognitive/behavioral therapy, trauma-related counseling, rational emotive behavioral therapy, motivational interviewing, anger management, and relapse prevention.
This center also scored 5.01 for cost. Acceptable payment options include government-funded programs, such as Medicaid, private or state-funded health insurance, and self-payment. Clients who do not have access to any government or private health benefits can take advantage of a sliding fee scale, which is dependent upon multiple factors, including income. Payment assistance may also be available upon inquiry.
- Rehabilitation Services Provided: 3.33
- Treatment Approaches: 1.43
- Cost: 5.01
- Special Programs for Unique Demographics: 6.66
- Ancillary Services: 1.66
Top-Rated, Low-Cost Treatment Centers in Minnesota
| Rank | Rehab | Total Score | Contact Information |
| #1 | Central Minnesota Mental Health Center | 6.8 | 308 12th Avenue South Buffalo, MN 55313 Main Tel: 763-682-4400 Intake Tel: 320-252-6654 |
| #2 | Central Minnesota Mental Health Center | 5.2 | 407 Washington Street Monticello, MN 55362 Main Tel: 763-295-4001 Intake Tel: 320-252-6654 |
| #3 | My Home, Inc. | 3.5 | 651 University Avenue Saint Paul, MN 55104 Main Tel: 651-659-0359 |
| #4 | Elite Recovery | 3.1 | 1145 Grand Avenue Saint Paul, MN 55105 Main Tel: 612-719-4137 |
| #5 | Senior Recovery Program | 2.2 | 235 Roselawn Avenue East Saint Paul, MN 55117 Main Tel: 651-773-0473 |
| #6 | Judy Retterath Withdrawal Management Center | 2.0 | 3409 East Medicine Lake Boulevard Plymouth, MN 55441 Main Tel: 763-559-1402 |
Finding a Substance Abuse Treatment Center in Minneapolis
Start by determining your coverage
For you to decide on your best options for a rehabilitation center, you need to understand your health coverage. First, reach out to your private or healthcare marketplace insurance provider to discover which centers you are able to utilize. To learn if you qualify for low-income Medicaid services, and to determine eligibility, visit the Minnesota Department of Human Services website. Regardless of your type of coverage, insurance companies, both public and private, must cover substance abuse treatment for qualified individuals.
Use our database to find a treatment center near you
The tool below lists all of the treatment centers in the state of Minnesota recognized by the Substance Abuse and Mental Health Services Administration (SAMHSA). Input your zip code and select the filter icon to find relevant treatment centers near you.
Schedule an assessment
If you are pursuing treatment that your insurance will cover, the first step on your path to recovery will most likely be scheduling an assessment by a qualified individual, such as a counselor or therapist. Most facilities provide these assessments, or your primary care provider may be able to refer you. Contact the companies in our database above to learn if they will provide this service.
Find a Rehabilitation Facility Near You

Filter Your Search
Popular Searches
Type Of Care
Treatment Approaches
Service Setting
Age Groups Accepted
Ancillary Services
Facility Operation
Facility Smoking Policy
Gender Accepted
Language Services
License Certification Accreditation
Payment Assistance Available
Payment Methods and Insurance Accepted
Special Programs Groups Offered
What to Expect in Rehab
Addiction treatment is a multifaceted industry that is comprised of a multitude of techniques and philosophies. As a result, the science of studying addiction is continually in flux, both shifting and improving. However, the core elements of rehabilitation are very similar.
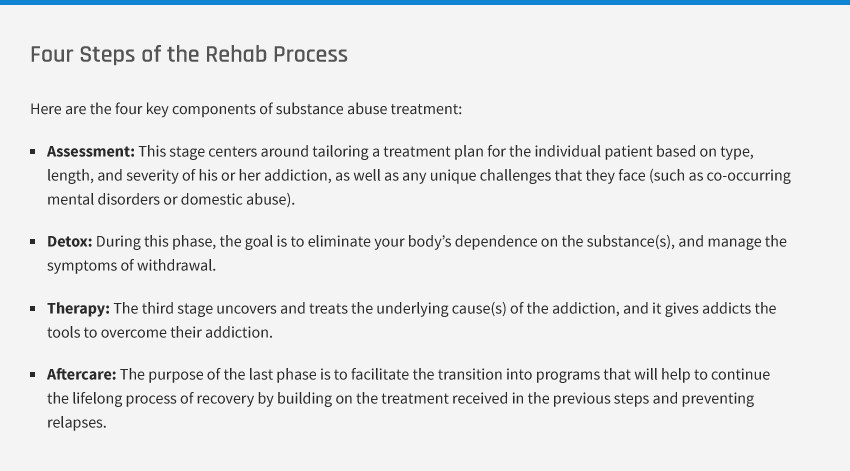
For more on what to expect in rehab, read our guide on the addiction rehabilitation process
Finding Aftercare in Minneapolis
The rehabilitation process is sometimes a venture that lasts a lifetime, and proper aftercare upon release from a rehab facility reduces the chances of relapse. A variety of aftercare options provide flexibility to the community, such as group therapy, sober living homes, and follow-up visits for continued therapy. Research reveals that long-term participation in aftercare activities dramatically improves the ultimate results of rehabilitation efforts.
The 12-step process for recovering from alcohol addiction was created by Alcoholics Anonymous – also typically referred to as AA – a nationwide addiction support group. Today, many other resources follow a similar path, including Narcotics Anonymous – or NA – for those struggling with drug addiction.
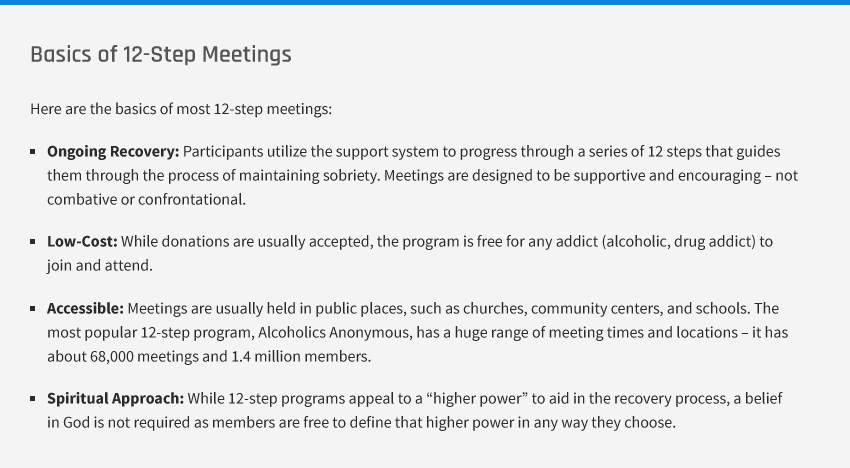
Contact the appropriate local organization to find an AA or NA meeting near you
See our directory tool below to find local organizations that can help you to locate Alcoholics Anonymous (AA) or Narcotics Anonymous (NA) group meetings in your area. Meeting times and locations can always change; however, so it is best to call ahead to ensure the online information is accurate.
Alcoholics Anonymous (AA) and Narcotics Anonymous (NA) Database
| Name | City | Program | Telephone | Spanish Hotline |
|---|
Sober Living Homes
Sober living homes, or recovery residences, assist recovering addicts with the process of evolving into functional members of society and encouraging independence while helping residents to remain sober. These homes have a supportive and positive environment that is particularly beneficial to addiction recovery, and residents’ recovery efforts are enhanced by a community that has a zero-tolerance policy towards alcohol and drugs. Research shows that when persons integrate into a community that incentivizes productivity, in particular the cultivation of skills that aid in locating stable employment and building healthy relationships, they are encouraged to both break free of the cycle of substance abuse and focus on creating a life not defined by their addiction.
Residents of sober living homes are expected to care for their space as if they were renting, including completing chores that are often assigned to residents, as well as paying rent costs. Support groups in the home are based on house principles, and attendance is usually mandatory. Residents are typically welcome to stay from a few months to several years, given they follow all rules and avoid relapse, as these homes often have no tolerance for drug and alcohol use.
You can find sober living homes in Minneapolis by checking our database, or you can select the appropriate filter from our tool above. Alternatively, you can head to our guide on sober living homes to learn more about them, as well as search for a certified recovery residence in your area.
Substance Abuse in Minneapolis
Treatment admissions for methamphetamine and opioid addiction continues to rise in Minneapolis
Admissions to substance abuse treatment programs in the Minneapolis area rose from 21,856 in 2012 to 22,218 in 2016. While treatment admissions for alcohol addiction represented 37.3% of all treatment admissions in 2016, the actual number of treatment admissions for alcohol addiction fell 13.67% from 2012 to 2016. Conversely, the number of treatment admissions for methamphetamine addiction increased by an astonishing 58.72%, from 2,185 in 2012 to 3,468 in 2016. By comparison, treatment admissions for heroin and other opioid addiction rose 7.44% between 2012 and 2016. This shift in substance abuse program admissions reflects the growing methamphetamine and opioid epidemic in Hennepin County.
Substance Abuse Treatment Admissions in the Minneapolis Area, 2012-2016
| Year | Alcohol | Marijuana | Cocaine | Meth | Heroin | Other | Total |
| 2013 | 9,601 | 3,390 | 944 | 2,185 | 5,144 | 592 | 21,856 |
| 2014 | 9,444 | 3,246 | 935 | 2,593 | 5,126 | 584 | 21,928 |
| 2015 | 8,971 | 3,426 | 976 | 2,954 | 5,675 | 633 | 22,635 |
| 2016 | 8,289 | 3,254 | 1,012 | 3,468 | 5,527 | 668 | 22,218 |
| % Change | -13.67% | -4.01% | 7.20% | 58.72% | 7.45% | 12.84% | 1.66% |
Source: Drug Abuse Trends in the Minneapolis/St. Paul Metropolitan Area, 2017
Despite new initiatives, overdose deaths from opioids, methamphetamines and cocaine continue to rise in Hennepin County
Drug overdose deaths continue to be a serious issue in Hennepin County. Although the county has undertaken several initiatives to curb opioid usage in recent years, opioid-related overdose deaths jumped 57.73% in a one-year span, rising from 97 in 2015 to 153 in 2016. On a slightly more positive note, for every 100 residents, the county reported an average opioid prescription rate of 38.6 prescriptions per every 100 residents in 2016, a decrease from the average opioid prescription rate of 43.2 prescriptions for every 100 residents in 2015.
Opioid use impacts various demographics differently within Hennepin County. Opioid overdose deaths disproportionately affect young adults between the ages of 15 to 24, representing 22% of all deaths in 2016 for that age group. Even more concerning, this percentage increased from 13% in 2010 and a mere 2% in 2000. Furthermore, distinct racial disparities exist in regard to opioid use as well, with 17.4% of deaths among African Americans and 10.1% of deaths among American Indians between 2000 and 2016 being the result of opioid overdose.
Overdose Deaths in Hennepin County, 2012-2016
| Year | Opioid Overdose Deaths | Cocaine Overdose Deaths | Methamphetamine Overdose Deaths |
|---|---|---|---|
| 2012 | 84 | 18 | 14 |
| 2013 | 132 | 28 | 16 |
| 2014 | 102 | 12 | 11 |
| 2015 | 97 | 26 | 17 |
| 2016 | 153 | 34 | 15 |
Source: Drug Abuse Trends in the Minneapolis/St. Paul Metropolitan Area, 2017
Hennepin County has a higher rate of drug and alcohol-related deaths than the national average
14.08%
of Hennepin County deaths are caused by drugs and alcohol
12.71%
of US deaths are caused by drugs and alcohol
Data gathered from CDC Wonder
Drug and Alcohol-Induced Deaths Between 2008 and 2017
| Ages: 1-17 | Ages: 18-64 | Ages: 1-64 |
|
| Drug-Induced Deaths in Hennepin County | 6 | 9,788 | 9,794 |
| Alcohol-Induced Deaths in Hennepin County | 3 | 3,476 | 3,479 |
| Total Deaths in Hennepin County | 1,281 | 92,968 | 94,249 |
| Percentage of Drug & Alcohol-Induced Deaths in Hennepin County | 0.70% | 14.27% | 14.08% |
Data gathered from CDC Wonder
Key Indicators of Substance Abuse
Collecting data on exactly how communities are affected by substance use disorders can be complicated because people tend to be reluctant to be honest about addiction for a multitude of reasons. Nevertheless, we can consider several data points to understand the larger impact of substance abuse in Minneapolis. We located statistics from sectors such as homelessness rates and DWI arrest rates across the area to provide a broader view of how substance abuse issues impact Minneapolis.
Substance abuse among Hennepin County’s homeless population continues to rise
The 2018 Minnesota Homeless Study revealed that Hennepin County experienced an increase in the overall homeless population of 11.11% in recent years, from 3,665 in 2015 to 4,072 to 2018. Alarmingly, over the previous eleven-year period, the number of homeless persons living unsheltered rose 38.5%, but in the subsequent three-year period from 2015 to 2018, the number of unsheltered homeless persons increased 164%.
A connection persists between homelessness and substance abuse in Hennepin County, as both the overall number of homeless persons and the number of homeless persons reporting substance abuse increased between 2015 and 2018. In 2018, 24% of homeless adults age 18 and over reported a substance use disorder, a 6% increase from the number of homeless persons reporting a substance use disorder in 2015. Although Hennepin County has initiated several programs over a ten-year period to reduce homelessness, it continues to be a very persistent and problematic issue.
Hennepin County Homeless Population and Related Substance Abuse, 2009-2018
The drunk driving (DWI) arrest rate has fallen in Hennepin County in recent years
Between 2013 and 2017, DWI arrests decreased both in Hennepin County and in the state of Minnesota. Although the number of DWI arrests for Hennepin County rose a slight 1.7% from 2016 to 2017, there was an overall decrease of 9.2% in the number of DWI arrests between 2013 to 2017. Statewide, DWI arrests fell 3.33% over the same five-year period.
Total Number of DWI Arrests, 2013-2017
| Year | DWI Arrests in Hennepin County | DWI Arrests in Minnesota |
|---|---|---|
| 2013 | 6,455 | 25,719 |
| 2014 | 5,864 | 25,258 |
| 2015 | 5,812 | 25,027 |
| 2016 | 5,757 | 24,835 |
| 2017 | 5,858 | 24,862 |
Source: Minnesota Department of Public Safety, Office of Traffic Safety
Take Action
There are multiple resources in Minneapolis and the surrounding area for those persons struggling with substance dependency. Use our tool to discover a rehabilitation center near you that can help you to understand and determine both your insurance coverage and your rehabilitation needs. Many low-cost centers can be of assistance if you don’t have insurance or if you are concerned that you are unable to afford treatment.